Figure 3.

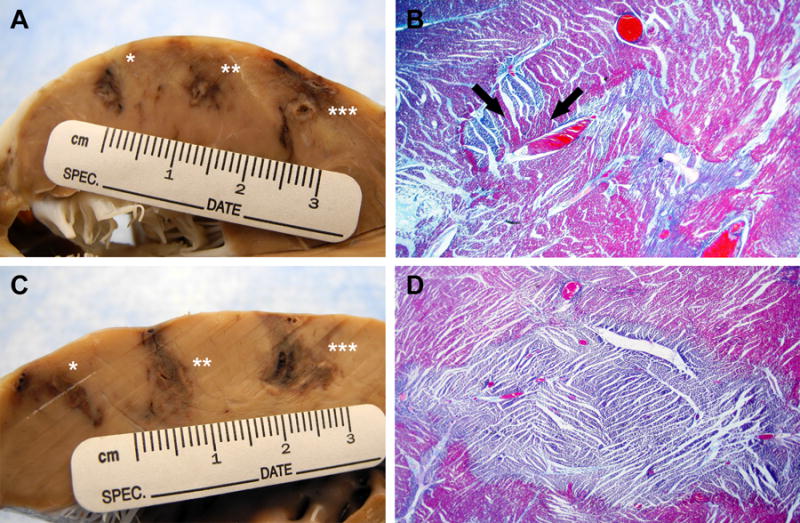
Ethanol vs. acetic acid (A) Macroscopic appearance after fixing in formalin of 70% ethanol 0.2mL(*), 0.4mL(**) and 0.6mL(***) injections. (B) Trichrome stain of 0.6mL ethanol lesion (20× magnification). Lesion has stellate geometry with patchy areas of normal myocardium within the ablation field (black arrows). (C) Macroscopic appearance of 50% acetic acid 0.2mL(*), 0.4mL(**) and 0.6mL(***) injections. (D) Trichrome stain of 0.4mL acetic acid lesion (20× magnification). Lesion is homogeneous with well-circumscribed border.
