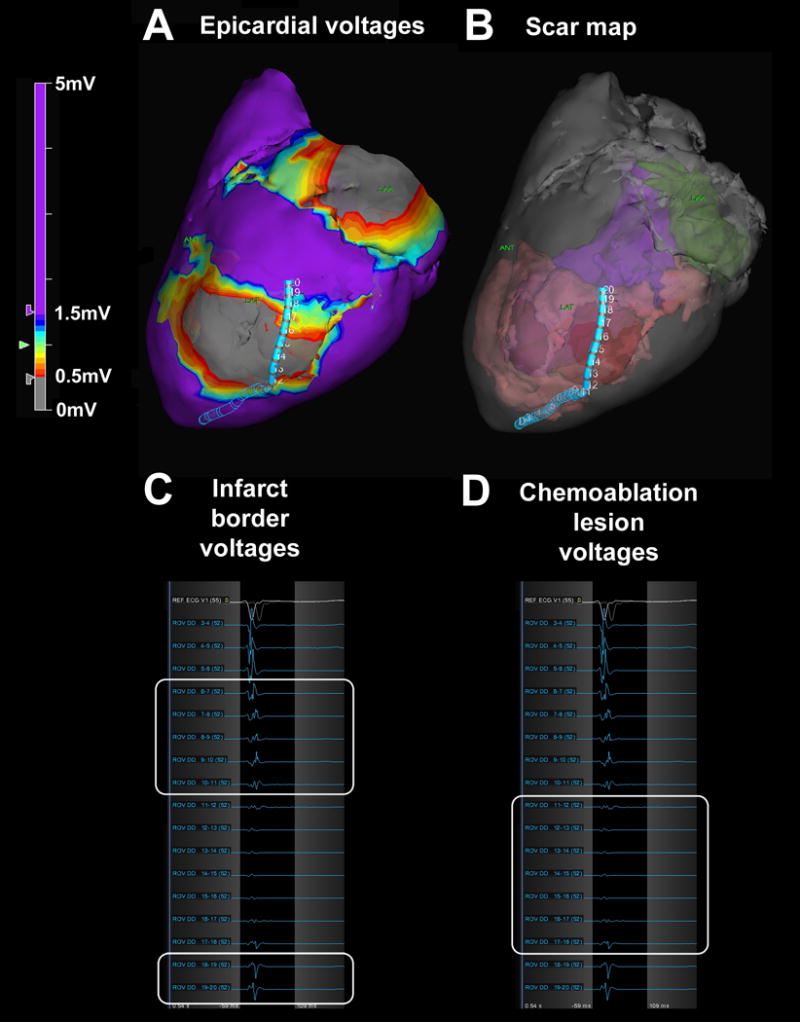
Figure 5.

Scar border geometry. (A) Epicardial voltage map showing the duo-decapolar mapping catheter spanning the chemoablation lesion. (B) Three-dimensional scar map derived from high-resolution ex-vivo MRI showing catheter position relative to pre-existing infarct (pink) and chemoablation lesion (red). The left ventricular cavity appears in purple and the left atrium in green. (C) Pre-existing infarct borders (white boxes) have low voltages (0.5–1.5mV), and (D) chemoablation lesion (white box) has extremely low voltages (<0.5mV).
