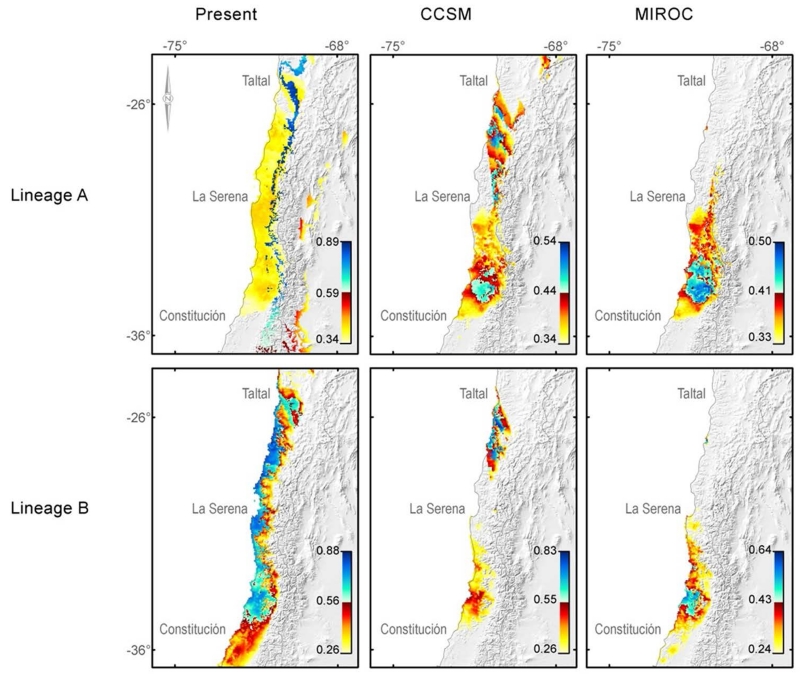
Figure 6.
Lineage distribution models. The figure shows the species distribution models for present and two LGM climatic models (columns). Models were built independently for each P. darwini’s intraspecific lineage (rows). Colour scale represents the full distribution of logistic probability values inside the suitability area determined by the maximum training sensitivity plus specificity logistic threshold; the white-blue portion of the colour scale represents highest 50% of logistic probability values observed inside the suitability area.

