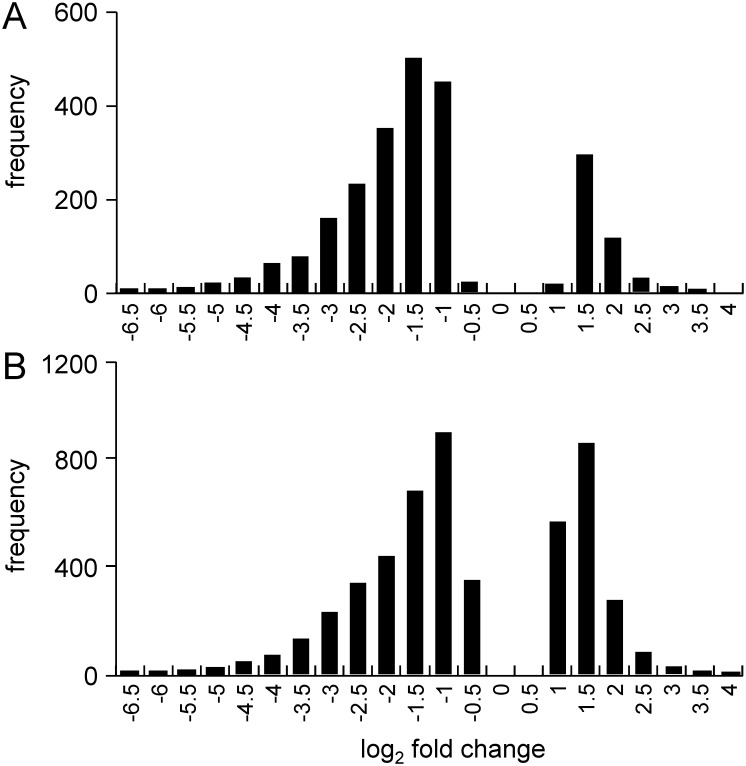
Fig 3. The distribution of the fold-change of differentially expressed genes in ED8.5 and 9.5 embryos.
Panels A and B show the fold-change of the 2305 and 4640 differentially expressed genes on ED8.5 and 9.5, respectively, with fold change ≥1.5, as detected after DESeq analysis. The X-axis shows bins with log2-fold change, while the Y-axis indicates the frequency of each event. Note that the majority of genes were downregulated in hyperglycemic embryos (~80% on ED8.5 and ~65% on ED9.5).

