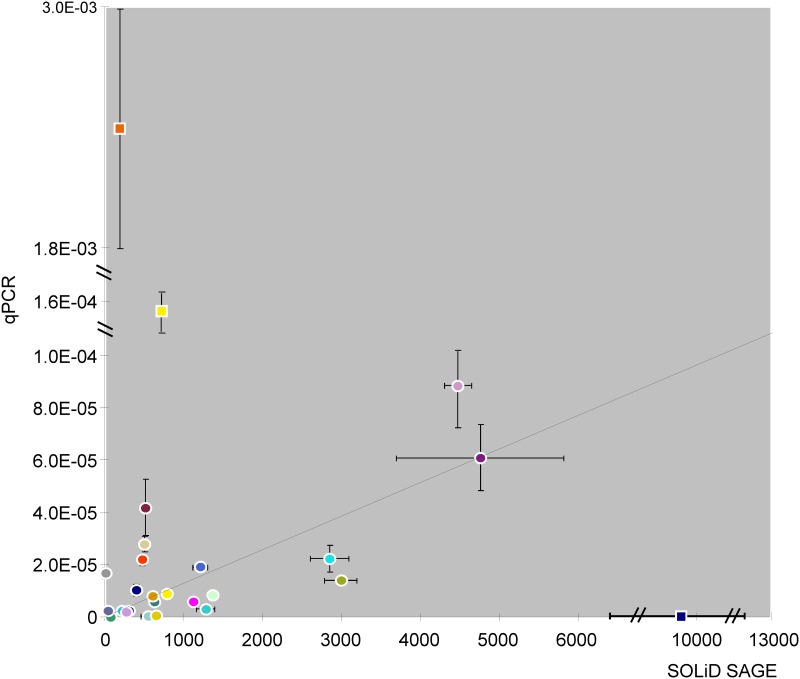
Fig 5. Correlation of mRNA expression levels analyzed by SOLiD SAGE sequencing and quantitative PCR analysis.
The mRNA of 8 euglycemic embryos on ED9.5 was quantified by SOLiD SAGE sequencing. Based on Padj (<0.05) and fold-change (>1.5) of differentially expressed genes in SOLiD SAGE sequencing, 11 genes without change, 4 up-regulated genes and 11 down-regulated genes were selected for validation by qPCR. The mRNA of 8 other euglycemic embryos on ED9.5 was quantified by qPCR after cDNA synthesis by gene-specific priming. The X-axis shows the number of reads after SOLiD SAGE sequencing and normalization for total reads in each embryo. The Y-axis indicates gene expression in qPCR normalized by the expression of reference genes Tor3a and 18S. The error bar indicates ± SEM.

