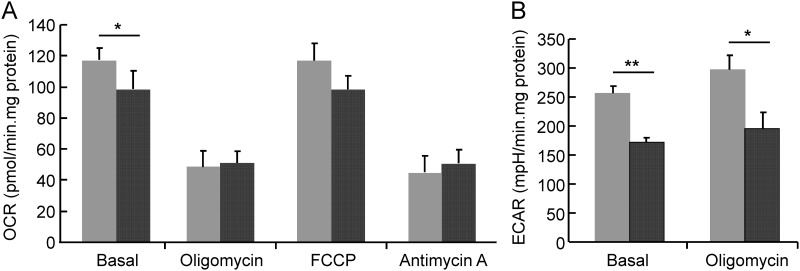
Fig 7. Oxygen consumption and extracellular acidification in cells of control and hyperglycemic embryos on ED9.5.
Cells obtained from 12 hyperglycemic and 17 control ED9.5 embryos were used to measure the rate of oxygen consumption (OCR; panel A) and extracellular acidification (ECAR; panel B). Gray bars represent cells from control and black bars from hyperglycemic embryos. The bars indicate the OCR and ECAR under basal conditions and after sequential addition of oligomycin, FCCP and antimycin A. Data represent 3 consecutive measurements of separate dishes with cells from 4 hyperglycemic embryos and 6 control embryos on average. The Y-axis indicates oxygen consumption (pmoles/min.mg protein) or extracellular acidification (mpH/min.mg protein). The asterisk indicates a significant difference between control and hyperglycemic embryos. **: P < 0.01. *: P = 0.03 (basal OCR control vs diabetic) and P = 0.01 (ECAR after treatment of oligomycin control vs diabetic).

