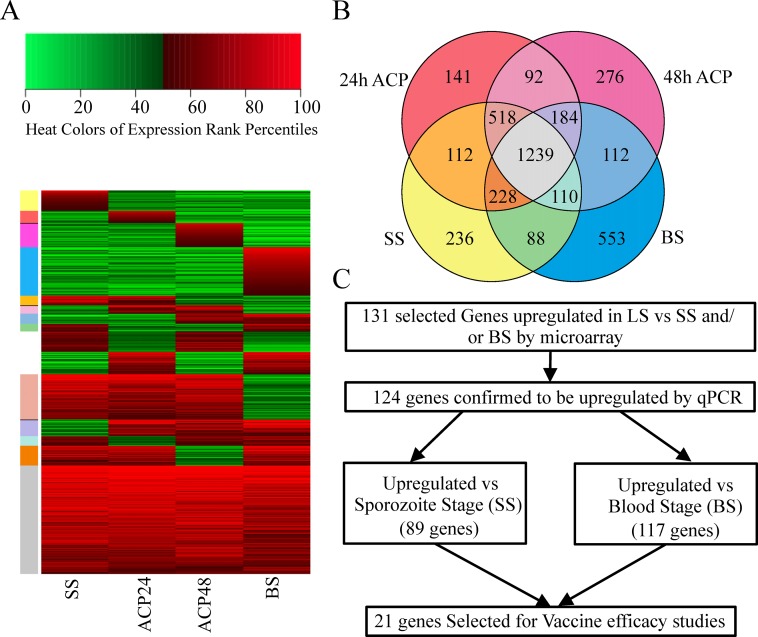
Fig 1. Gene expression profile of Pf genes and selection algorithm used for antigen selection.
(A) Heat map of gene expression by tiling microarray. Red color represents the genes expressing above the 50th percentile, while green color represents genes expressing below the 50th. The heat map shows the expression profile of genes across SS, 24h and 48h axenically cultured LS, and BS parasites. (B) Venn diagram shows stage-specific expression of genes by tiling microarray. Color coding of Venn regions matches the color bar provided for the heat map in Panel A. (C) Selection of genes for vaccine evaluation in two rodent models. One hundred and thirty-one genes were selected from among the upregulated genes identified by tiling-microarray, and 124 were confirmed by qPCR to be transcribed at higher levels in LS versus SS and/or BS parasite samples. Twenty-one of these 124 genes were selected for further evaluation as vaccine candidates.

