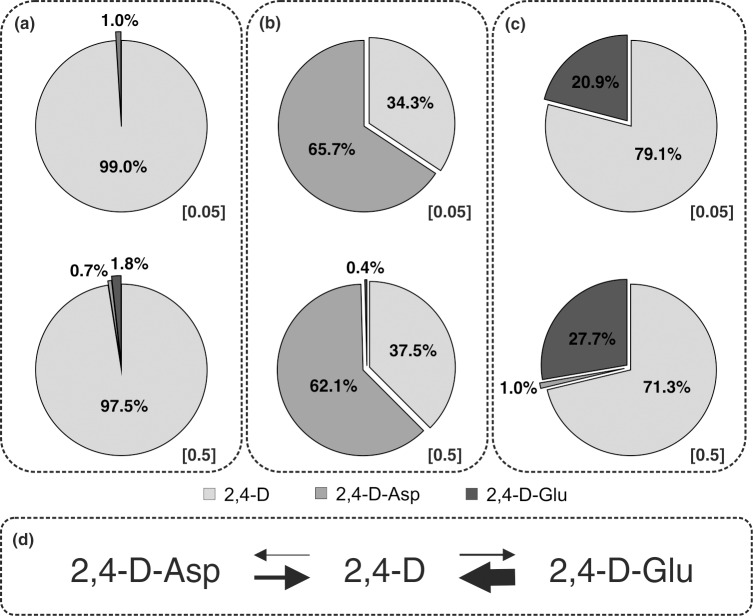
Fig 3. Distribution (%) of 2,4-D and its metabolites in Arabidopsis seedlings.
Plant tissues were grown on media supplemented with two concentrations (0.05 μM and 0.5 μM) of 2,4-D (A), 2,4-D-Asp (B) and 2,4-D-Glu (C), and metabolite distribution in each treatment was calculated from the levels (pmol g-1 FW) detected by UHPLC-MS/MS. In (D), 2,4-D homeostasis and different biosynthetic rates from/to free 2,4-D are indicated (the line thickness illustrates a predicted conversion rate of 2,4-D and its amino acid conjugates).

