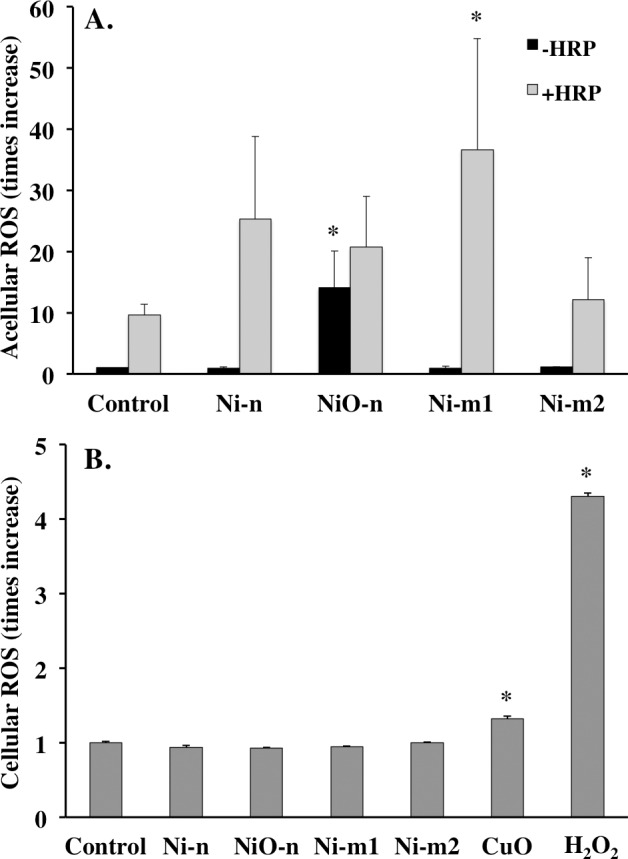
Fig 3. Oxidative reactivity.

(A) Acellular ROS production of Ni metal (Ni-n, Ni-m1 and Ni-m2) and Ni oxide (NiO-n) particles (20 μg mL-1 of total Ni) studied with the acellular DCFH-DA assay in the presence (+HRP) and absence (-HRP) of a catalyst (Horse Radish Peroxidase). The oxidative reactivity is presented as the change in fluorescence intensity when compared with control (PBS with DCFH). (B) Intracellular ROS production in A549 cells exposed to Ni metal (Ni-n, Ni-m1 and Ni-m2) and Ni oxide (NiO-n) particles (20 μg mL-1 of total Ni) using the cellular DCFH-DA assay. Nano-sized CuO and H2O2 were used as positive controls. The ROS increase was calculated as mean slope per min and normalized to the unexposed control. The asterisk (*) assigns statistically significant (p<0.05) values compared with the corresponding control (PBS with DCFH ±HRP or unexposed cells).
