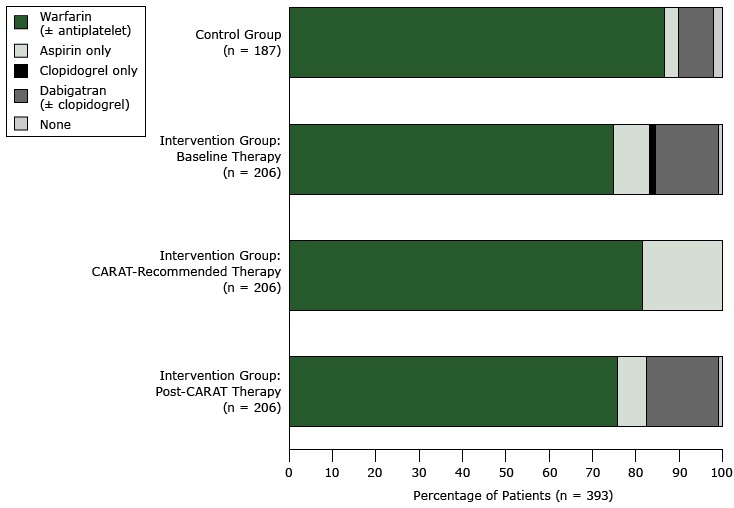
Figure 2.

Changes in the use of antithrombotic therapy, by type of therapy and by patient groups (intervention arm and control arm), in a cluster-randomized controlled trial of a computerized antithrombotic risk assessment tool in a sample of general practices in New South Wales, Australia, 2012–2013. Percentages may not total 100 because of rounding.
| Therapy | Number of Patients (Proportion of Patients by Intervention Group and Control Group) |
|||
|---|---|---|---|---|
| Intervention Group: Baseline Therapy | Intervention Group: Post-CARAT Therapy | Intervention Group: CARAT-Recommended Therapy | Control Group | |
| Warfarin (± antiplatelet) | 154 (74.8) | 156 (75.7) | 168 (81.6) | 162 (86.6) |
| Aspirin only | 17 (8.3) | 14 (6.8) | 38 (18.4) | 6 (3.2) |
| Clopidogrel only | 3 (1.5) | 0 (0.0) | 0 (0.0) | 0 (0.0) |
| Dabigatran (± clopidogrel) | 30 (14.6) | 34 (16.5) | 0 (0.0) | 15 (8.0) |
| None | 2 (1.0) | 2 (1.0) | 0 (0.0) | 4 (2.1) |
| Total | 206 (100.2) | 206 (100.0) | 206 (100.0) | 187 (99.9) |
