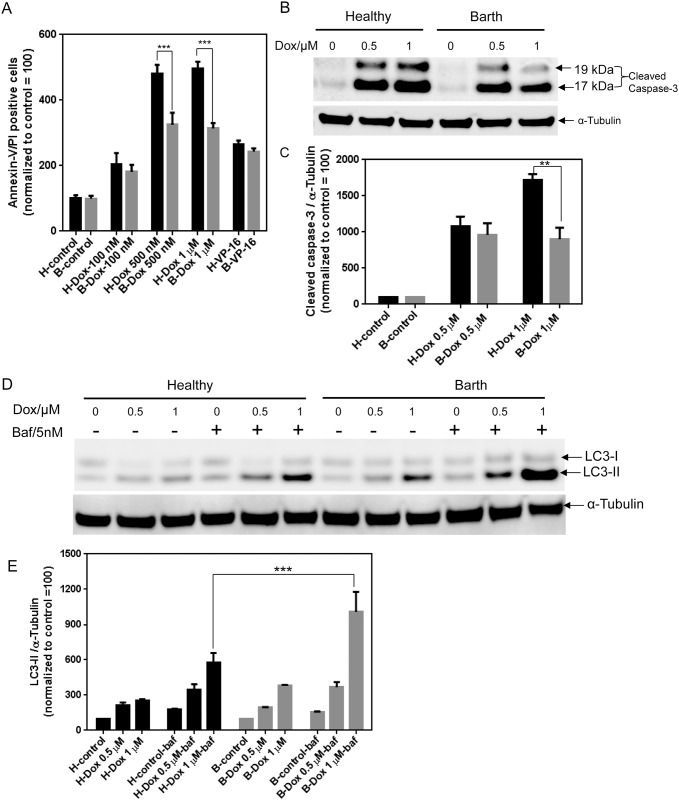
Fig 1. Dox-induced cell death in Barth and healthy lymphocytes.
(A) Annexin V and propidium iodide staining was used to measure induction of apoptosis by 0.1, 0.5, and 1 μM of Dox following 24 h treatment. VP16 (10 μM) was used as a positive control. (B) Representative western blot showing the level of cleaved caspase-3 in healthy and Barth lymphocytes after 0.5 and 1 μM Dox treatment for 24 h. (C) Quantitative analysis of cleaved caspase-3 from (B) normalized by α-tubulin. Cleaved caspase-3 levels for control (untreated) healthy and Barth lymphocytes were normalized to 100 and Dox-induced changes in cleaved caspase-3 were normalized against corresponding control. (D) Representative western blot showing the level of autophagy induction determined by LC3-II levels in healthy and Barth lymphocytes after 0.5 and 1 μM Dox treatment for 24 h with or without 5 nM bafilomycin A1 for final 2 h of Dox treatment. (E) Quantitative analysis of LC3-II from (D) normalized by α-tubulin. LC3-II levels for control (untreated) healthy and Barth lymphocytes were normalized to 100 and Dox-induced changes in LC3-II level in the presence or absence of bafilomycin A1 were normalized against corresponding control. *p<0.05; **p<0.001; H = healthy B-lymphocytes, B = Barth B-lymphocytes, Baf = bafilomycin A1.

