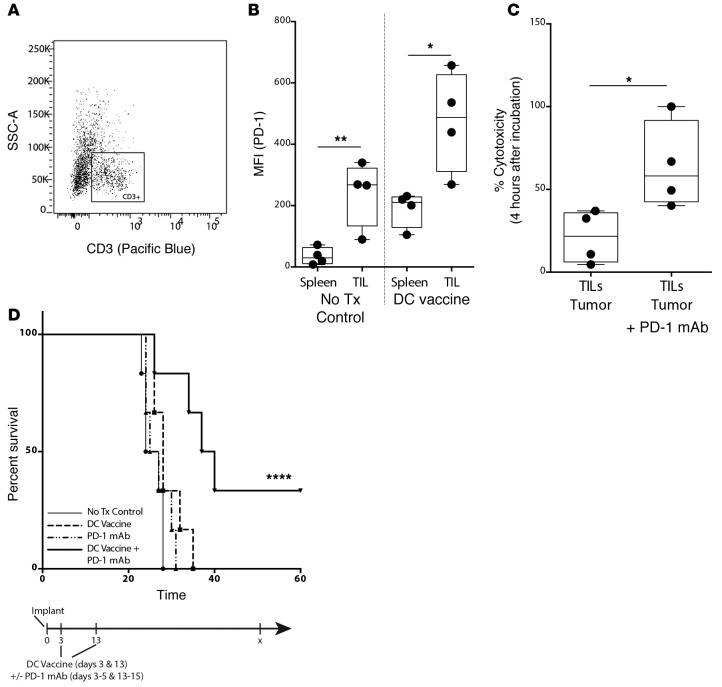
Figure 2. PD-1 blockade rescues the survival benefit after DC vaccination in mice with established tumor burden.
(A) Splenic and tumor-infiltrating lymphocytes (TILs) were gated for CD3 expression and (B) median fluorescence intensity (MFI) of PD-1 expression on CD3+ cells quantified between control nontreatment (No Tx) and DC vaccine treatment groups (n = 4/group). Data shown are representative of 1 experiment repeated 2 times with similar findings. FACS-sorted CD3+Thy1.2+ TILs from DC vaccine–treated tumor-bearing mice were cocultured with i.c.-derived tumor bulk with or without ex vivo PD-1 mAb, and tumor cytolysis (C) at 4 hours was quantified (*P < 0.05) (n = 4/group). (D) Mice were randomized into control (tumor-bearing, no treatment), PD-1 mAb, DC vaccine, and DC vaccine plus PD-1 mAb treatment groups. Graphs show evaluation of survival (n = 6/group) (***P < 0.001). Data shown are representative of 1 experiment repeated 4 times with similar findings. Each point represents 1 cell (A) or 1 subject (B–D). Box-and-whisker plots are used to graphically represent the median (line within box), upper- and lower- quartile (bounds of box), and maximum and minimum values (bars) (B and C). A Student’s t test was used to calculate statistical significance (B and C), and survival differences were calculated using log rank statistical tests and graphed using the method of Kaplan-Meier (D).

