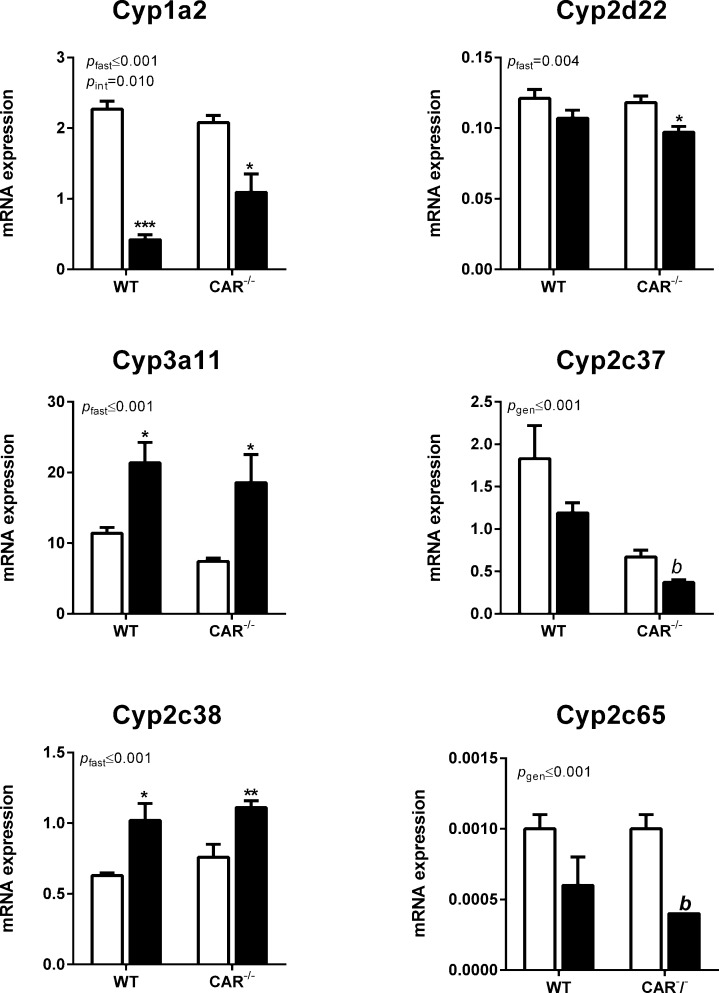
Fig 2. P450 enzyme mRNA expression in the saline injected WT and CAR-/- mice.
Fed mice (white bars), fasted mice (black bars). P-values represent the effect of fasting (pfast), genotype (pgen) or the interaction of both variables (pint) in the two-way ANOVA (n = 6 per group). Differences between groups as tested by posthoc Student’s t-test or nonparametric Mann Whitney U test are represented by * in case of the fed vs fasted groups (* = p≤0.05, ** = p≤0.01, *** = p≤0.001) and by b in case of the WT vs CAR-/- groups (b = p≤0.01)

