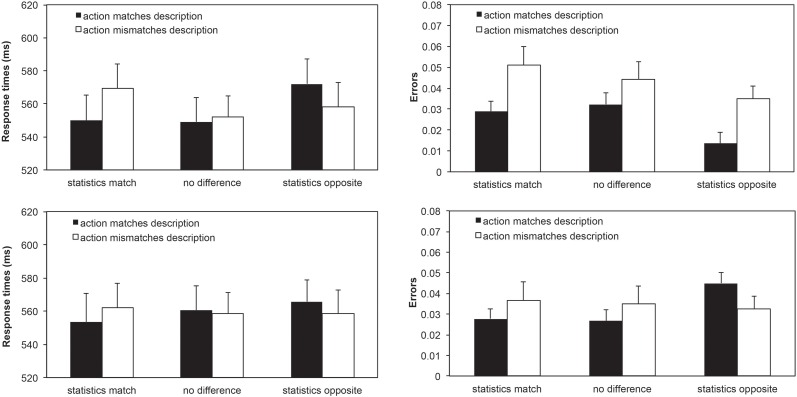
Fig 3. RTs and error rates for Experiment 2.
The black bars represent trials which followed the hypothesis and the white bars represent trials, which are the opposite of the hypothesis. The left side shows the response times and the right side shows error rates. The top row indicates actions towards objects and the bottom row indicates withdrawals. Error bars show the standard error of the mean.

