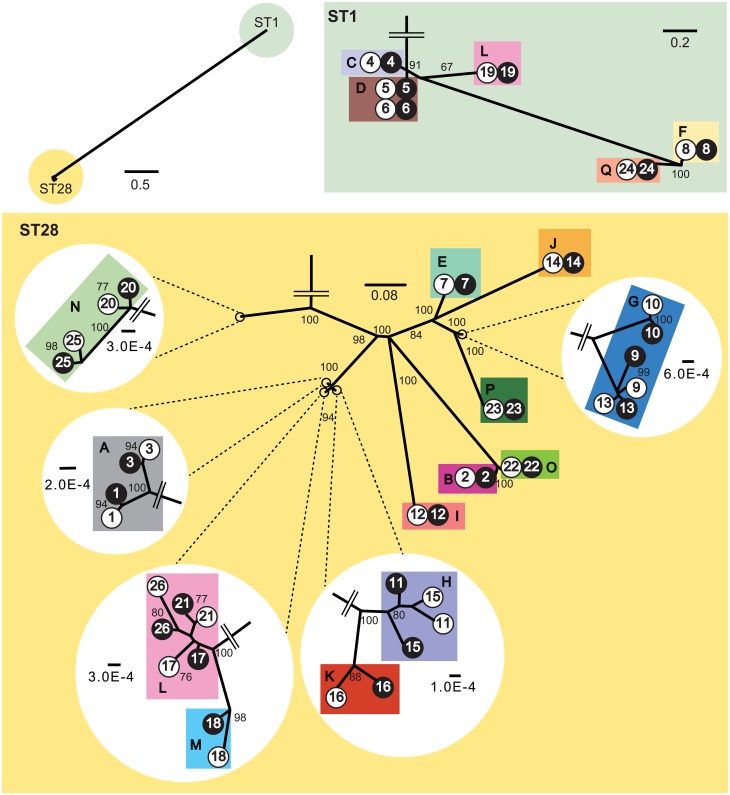
Fig 2. A phylogenetic tree for 26 encapsulated and 26 unencapsulated S. suis isolates.
The tree was constructed using the maximum parsimony method for genome-wide SNPs in 52 S. suis isolates. The 52 isolates analyzed were composed of 26 encapsulated and unencapsulated isolate pairs from 17 porcine farms, indicated by the following symbols: blank circles for encapsulated, and filled circles for unencapsulated isolates, with pair Nos. and farm identifiers (colored rectangles) along with the symbols. The isolates were separately clustered into two STs, ST1 and ST28; a detailed tree structure in each ST is shown as an enlarged tree. Several ends of the enlarged tree in ST28 are further enlarged. Seventeen colors are used to show distribution of farms in the tree. Only the bootstrap values >50% are indicated on the branches.

