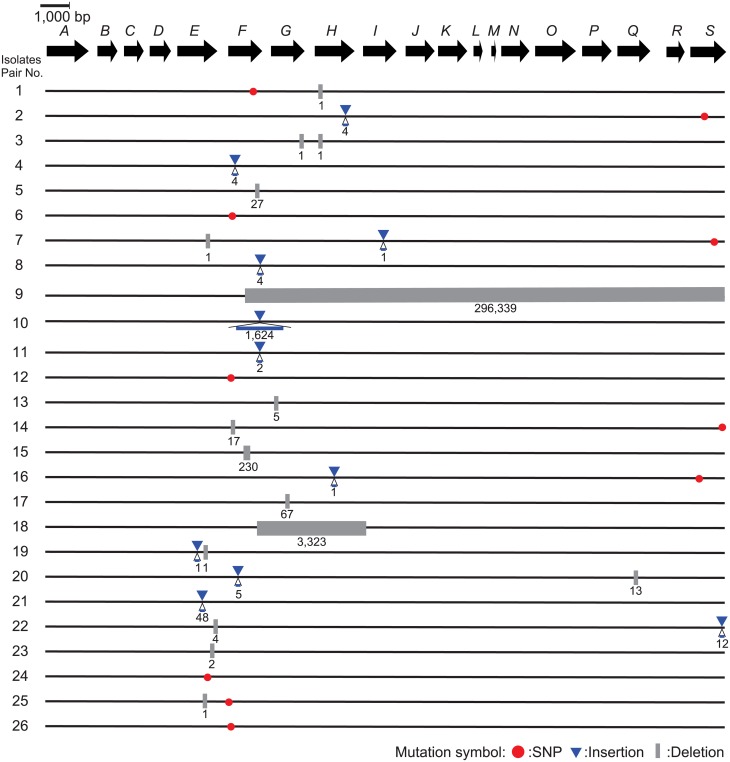
Fig 3. Nonsynonymous mutations and indels in the cps gene cluster between encapsulated and unencapsulated S. suis isolates in 26 pairs.
The genetic organization of the cps gene cluster (from cps2A to cps2S) is shown as a sequence of the arrows located by transcriptional directions with the identifiers such as “A” for “cps2A”. The mutations between encapsulated and unencapsulated isolates in each pair are shown along with the genetic map, with the following symbols: red circles for nonsynonymous mutations, blue triangles for insertions, and gray rectangles for deletions along with the nucleotide length of the mutations.

