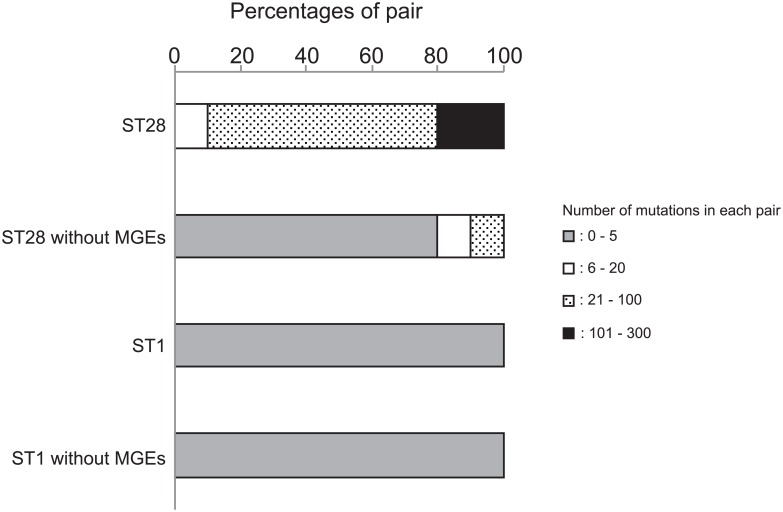
Fig 5. The proportion of each pair classified by number of mutations.
The number of mutations was calculated in each of 26 pairs, and its distribution is shown in ST1 and ST28 isolates as a percentage of pairs, as follows: gray bars for pairs with 0–5 mutations, blank bars for 6–20, dotted bars for 21–100, and filled bars for 101–300. Percentages are shown in ST1 and ST28 clones when genes on MGEs are excluded from the calculation.

