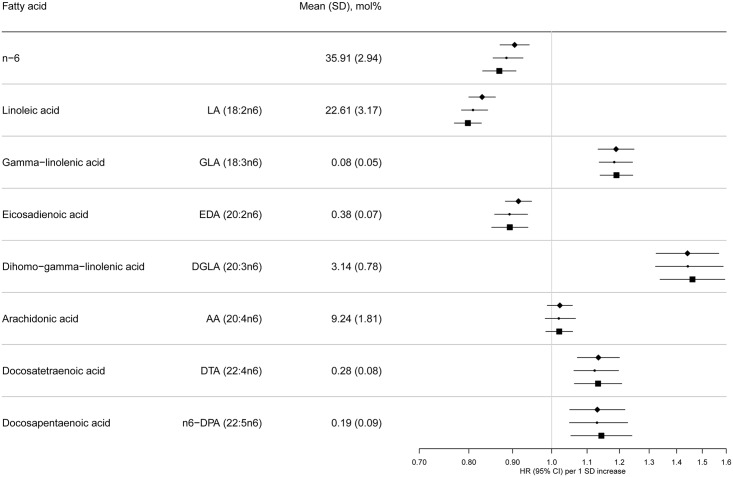
Fig 3. HRs of T2D and 95% CIs per 1 SD increase in total and individual n-6 PUFAs (LA, GLA, EDA, DGLA, AA, DTA, and n-6 DPA): EPIC-InterAct study.
Model 1: displayed as diamonds. Age as underlying time variable, and adjusted for centre, sex, physical activity (inactive, moderately inactive, moderately active, or active), smoking (never, former, or current), education level (none, primary school, technical or professional school, secondary school, or higher education), and BMI (continuous, kg/m2). Model 2: displayed as circles. Adjusted as in Model 1 + total energy intake (continuous, kcal/d), alcohol (none, >0–<6, 6–<12, 12–<24 and ≥24 g/d), and (continuous, g/d intake of) meat, fruit and vegetables, dairy products, and soft drinks. Model 3: Displayed as squares. Adjusted as in Model 2 + (continuous, g/d intake of) fish and shellfish, nuts and seeds, vegetable oil, olive oil, and margarine.

