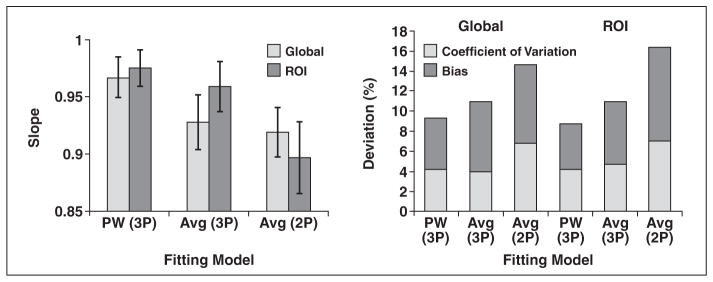
Fig. 1.
Effect of fat suppression on R2* estimation. Regression slope (left) is shown as function of fitting model. Error bars denote 95% CIs. Bias and coefficient of variation are shown for images collected with and without saturation (right). Bias is displayed as absolute value to facilitate plotting (fat saturation consistently lowered R2* estimates). 2P = two parameter, 3P = three parameter, Avg = average, PW = pixelwise.

