. 2016 Jun 1;5:e14155. doi: 10.7554/eLife.14155

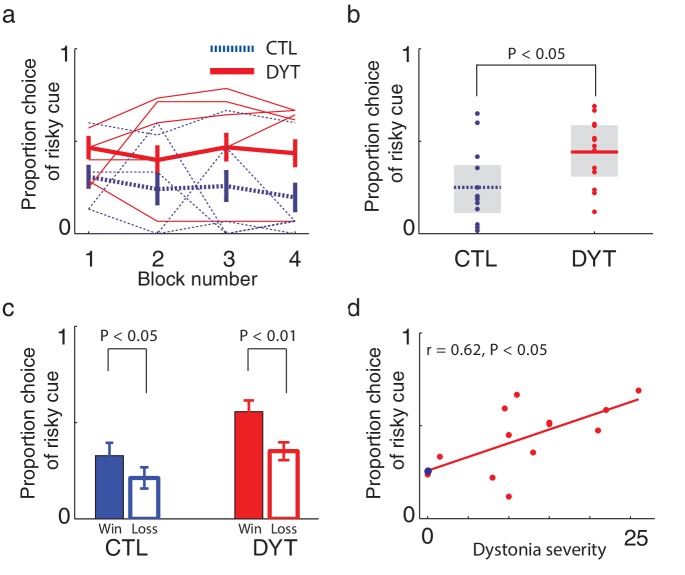
Figure 3. Risk taking in DYT1 dystonia patients as compared to healthy sex- and age-matched controls.

(a) Mean proportion (± s.e.m) of choosing the risky 0/10¢ cue over the sure 5¢ cue (15 trials per block) in each of the groups. DYT1 dystonia patients (red solid) were less risk-averse than controls (blue dashed). Results from several randomly-selected participants are plotted in the background to illustrate within-participant fluctuations in risk preference over the course of the experiment, presumably driven by ongoing trial-and-error learning. (b) Overall percentage of choosing the risky 0/10¢ cue throughout the experiment. Horizontal lines denote group means; grey boxes contain the 25th to 75th percentiles. DYT1 dystonia patients showed significantly more risk-taking behavior than healthy controls. (c) Proportion of choices of the risky 0/10¢ cue over the sure 5¢ cue, divided according to the outcome of the previous instance in which the risky cue was selected. Both controls and DYT1 dystonia patients chose the risky 0/10¢ cue significantly more often after a 10¢ ‘win’ than after a 0¢ ‘loss’ outcome, demonstrating the effect of previous outcomes on the current value of the risky 0/10¢ cue due to ongoing reinforcement learning. Error bars: s.e.m. The effect of recent outcomes on the propensity to choose the risky option was evident throughout the task, especially in the DYT group, and was seen after both free choice and forced trials (Figure 3—figure supplement 1), suggesting that participants continuously updated the value of the risky cue based on feedback, and used this learned value to determine their choices. (d) Risk taking was correlated with clinical severity of dystonia (Fahn-Marsden dystonia rating scale). The mean of the control group is denoted in blue for illustration purposes only. Interestingly, the regression line for DYT1 dystonia patients’ risk preference intersected the ordinate (0 severity of symptoms) close to the mean risk preference of healthy controls.

DOI: http://dx.doi.org/10.7554/eLife.14155.005

Figure 3.

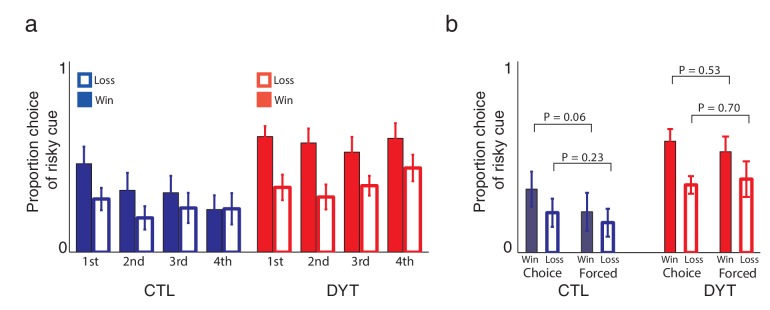
Figure 3—figure supplement 1. Learning about the risky cue continued throughout the task.

Figure 3—figure supplement 1.

(a) Our experimental design was aimed explicitly at focusing on learning about the risky cue so that we could analyze learning from positive and negative prediction errors decoupled from initial learning about deterministic cues. As shown in Figure 3c, participants’ tendency to choose the risky 0/10 cue over the same-mean 5¢ cue was dynamically adjusted according to experience: if the previous choice of the risky cue was rewarded with 10¢, participants were significantly more likely to choose the risky cue again on the next time it was available, as compared to the case in which the previous choice of the risky cue resulted in 0¢. To verify that the value of the risky cue was continuously updated, we calculated the proportion of choices of the risky cue over the sure 5¢ cue after different outcomes of the previous instance in which the risky cue was selected, for different time bins throughout the task (15 risky trials in each). A three way ANOVA (group X outcome X time-bin) revealed a significant effect for group (P < 0.001), outcome (win or loss; P < 0.001) and no effect of time-bin or interactions. Post-hoc comparisons revealed that the differences between win and loss conditions were significant in all bins for the DYT group only (all Ps < 0.05, two tailed). The first two bins for the CTL group approached significance (P = 0.054, two-tailed). This analysis showed that DYT patients changed their behavior based on outcomes of the risky cue throughout training. Control participants, on the other hand, evidenced somewhat less learning as the task continued, with their behavior in the last quarter of training settling on a risk-averse policy that was not sensitive to local outcomes. In reinforcement learning, this could result from a gradual decrease of learning rates, which is optimal in a stationary environment. Indeed, the final risk-averse policy was predicted by our model, based on the ratio of positive and negative learning rates. In any case, these results suggest that participants learned to evaluate the risky cue based on experienced rewards, and that the locally fluctuating value of the risky cue affected choice behavior, at least in the first half of the experiment, and for the DYT group, throughout the experiment. (b) Recent work on similar reinforcement learning tasks has shown that choice trials and forced trials may exert different effects on learning (Cockburn et al., 2014). To test for this effect in our data, we examined separately the probability of choosing the risky cue over the sure cue following wins or losses, after either forced or choice trials. Our analysis revealed that choices were significantly dependent upon the previous outcome of the risky cue (P < 0.01, F = 7.45, df = 1 for main effect of win versus loss; 3-way ANOVA with factors outcome, choice and group) but not upon its context (P = 0.38, F = 0.93, df = 1 for main effect of forced vs. choice trials). Similar to Cockburn et al. (2014), we did observe a numerically smaller effect of the outcome of forced trials (as compared to choice trials) on future choices, however this was not significant (interaction between outcome and choice P = 0.46, F = 0.56, df = 1). P values in the figure reflect paired t-tests.

Figure 3—figure supplement 2. Effects of ongoing learning in the simulated data.
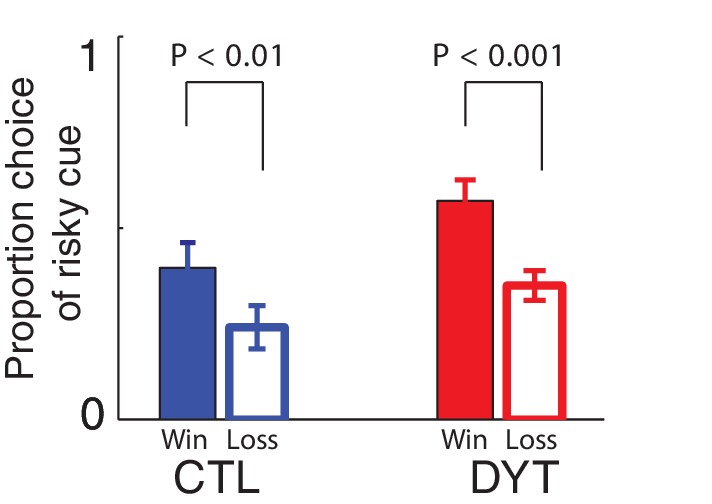
Figure 3—figure supplement 2.

Proportion of choices of the risky 0/10¢ cue over the sure 5¢ cue, divided according to the outcome of the previous instance in which the risky cue was selected, according to the asymmetric learning model with parameters fit to each participant’s behavior. The model captures the behavioral findings faithfully.

Figure 3—figure supplement 3. Sex of participants did not affect risk sensitivity in our task.
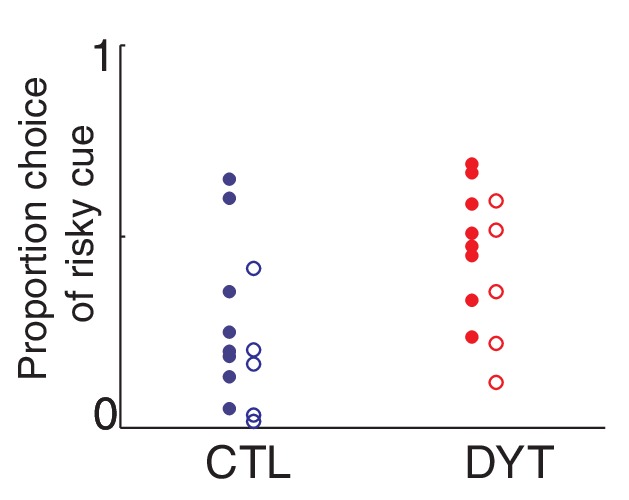
Figure 3—figure supplement 3.

To avoid any possible sex-dependent bias, we matched the sex of both groups when comparing control participants to DYT1 dystonia patients. Similar to Figure 3b, plotted are overall percentage of choices of the risky 0/10¢ cue over sure 5¢ cue throughout the experiment, for different participants (Female N = 8 in each group, filled dots; Male, N = 5 in each group, open dots). A two-way ANOVA (CTL/DYT x Male/Female) did not reveal a significant main effect of sex (P = 0.08) although this analysis is obviously underpowered. The difference between CTL and DYT remained significant in this analysis (P = 0.01 for the main effect of group).

Figure 3—figure supplement 4. Medication did not affect risk-sensitivity.

Figure 3—figure supplement 4.

To minimize the effect of medication on learning in our task, we tested patients before their scheduled dose of medication to the extent that this was possible. As in Figure 3b, plots show overall percentage of choices of the risky 0/10¢ cue over sure 5¢ cue throughout the experiment and its relation to medications and doses.(a) Similar risk-taking (choosing the risky 0/10¢ cue over the sure 5¢ cue) behavior among untreated patients and those taking trihexyphenidyl or baclofen, (b) lack of correlation between risk-taking behavior and the daily dose of trihexyphenidyl (Pearson’s r = 0.19, df = 11, P = 0.526) or (c) baclofen (Pearson’s r = −0.20, df = 11, P = 0.51) all suggested that medication did not contribute significantly to the observed results.