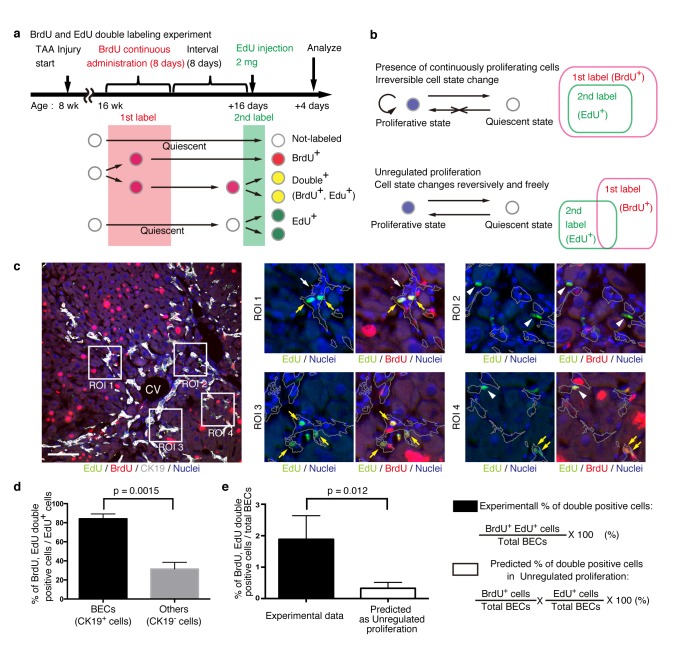
Figure 6. BECs do not proliferate uniformly and can be subdivided into those in the proliferative state and those in the quiescent state.
(a) Schematic diagram for the experimental design. At week 8 of the TAA injury model, mice were given BrdU via drinking water (0.8 mg/ml) for 8 days (1st label). After an interval of a further 8 days, the mice were intraperitoneally injected with EdU (2 mg/20 g body weight) for pulse labeling (2nd label). (b) Schematic diagram depicting two possible growth modes. In the top model, proliferative and quiescent cell populations can be distinguished by temporal state. This growth mode will give an experimental result in which the 2nd label+ cells are included within the 1st label+ cells. In the second model (bottom), the cells change their growth state in an unregulated manner, resulting in an un-biased labeling pattern. (c) Immunofluorescent staining results for BrdU and EdU incorporation together with CK19 immunostaining. Representative regions of interest (ROI 1–4) in the left panel are shown in the middle and right panels. In the magnified images, the boundaries of the CK19+ areas are delineated in gray lines. White arrowheads, EdU+ BrdU- cells; white arrows, non-labeled cells; yellow arrows, BrdU+ EdU+double-positive cells. Scale bar represents 100 μm. (d) Quantification of the BrdU+ EdU+ double-labeled cells. Data represents the mean ± SEM for 5 mice. (e) Comparison of the incidence of the BrdU+ EdU+ cells between the experimentally obtained data and the result predicted by the assumption that the BrdU and EdU labelings occur independently. p-value was calculated by two-tailed paired Student’s t-test. All experiments were performed with 5 biological replicates.

