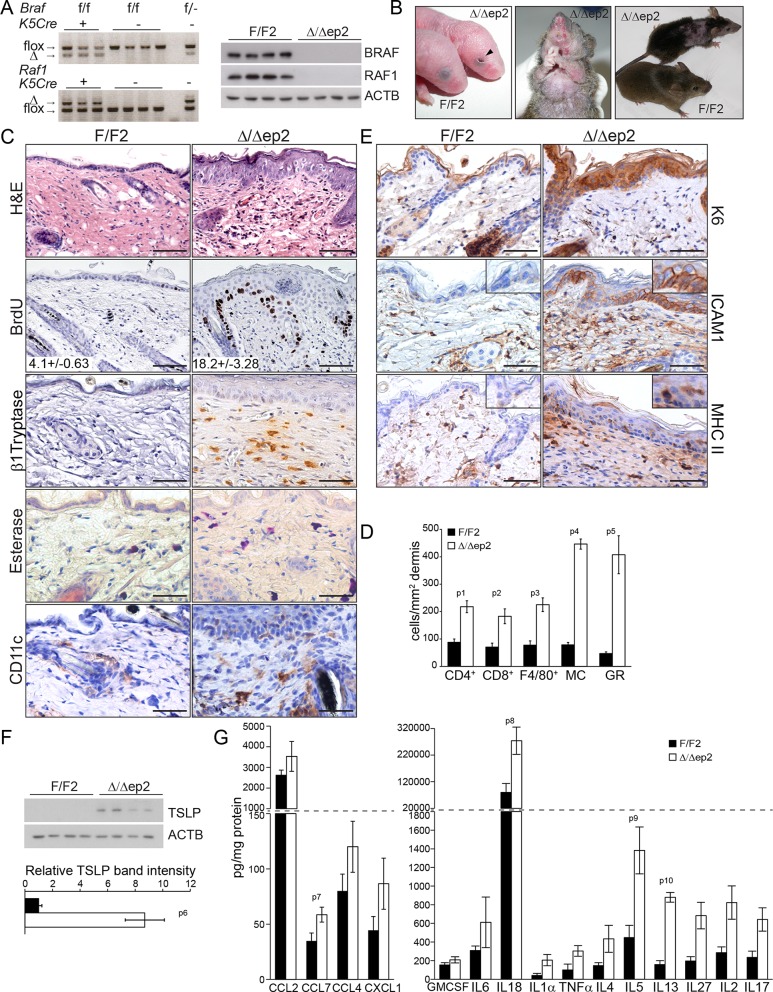
Figure 1. Compound deletion of BRAF and RAF1 in the epidermis leads to severe skin inflammation in adult mice.
(A) BRAF and RAF1 are efficiently deleted in epidermal cells as shown by PCR analysis of tail tissue and immunoblotting of epidermal lysates isolated from 3 weeks old F/F2 and Δ/Δep2 (n = 4). ACTB is shown as a loading control. (B) Macroscopic appearance of newborn and adult F/F2 and Δ/Δep2 mice. Arrowhead highlights the open eye phenotype of Δ/Δep2 pups. (C) Hematoxylin/eosin (H and E) staining shows epidermal thickening and dermal inflammatory infiltrates in Δ/Δep2 mice. BrdU incorporation confirms hyperproliferation in the basal layer of Δ/Δep2 epidermis. The numbers in the inset represent BrdU+ cells/mm2 of epidermis (n = 5–7, mean ± SEM). Infiltrating cells: activated mast cells (β1 Tryptase+), granulocytes (esterase+), dendritic cells (CD11c+). (D) Quantification of the infiltrating cells: T cells (CD4+ and CD8+), macrophages (F4/80+), total mast cells (MC, toluidine blue+), granulocytes (GR, esterase+). (E) Increased expression of K6, ICAM1, and MHC II in Δ/Δep2 keratinocytes/epidermis. Representative images (C, E) and quantification (D) of 5–7 individual couples. Scale bars, 50 µm. (F) Inflammatory chemokines and cytokines in epidermal lysates (n = 3–4). TSLP levels were determined by immunoblotting and quantified by Image J. ACTB served as a loading control. The results were normalized by arbitrarily setting one of the F/F2 samples as 1 and plotted as mean ± SEM. Data represent mean ± SEM. p = 0.011, p1 = 0.001, p2 = 0.007, p3 = 0.001, p4 = 3.06E-6, p5 = 1.37E-4, p6 = 0.002, p7 = 0.049, p8 = 0.042, p9 = 0.046 and p10 = 0.001.


