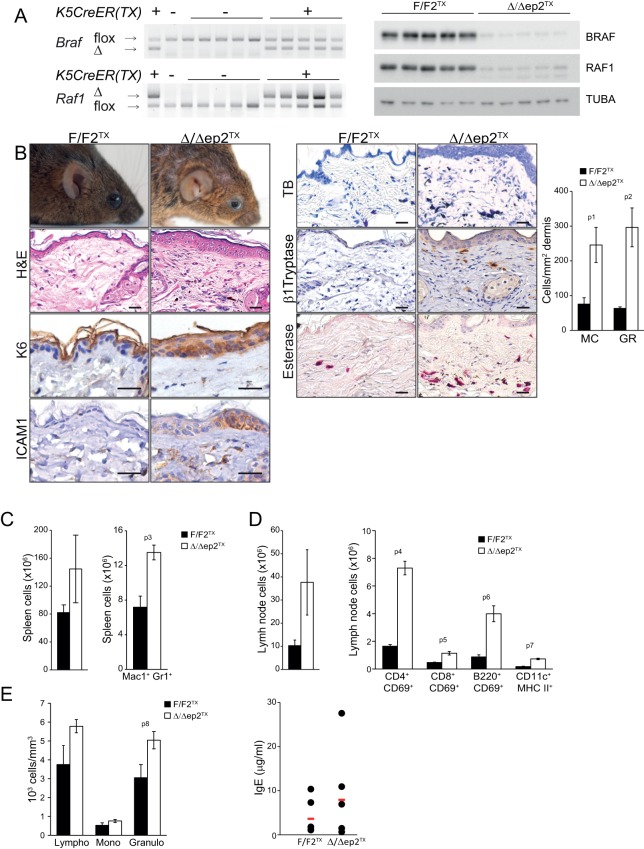
Figure 5. Local and systemic inflammation in Δ/Δep2TX mice.
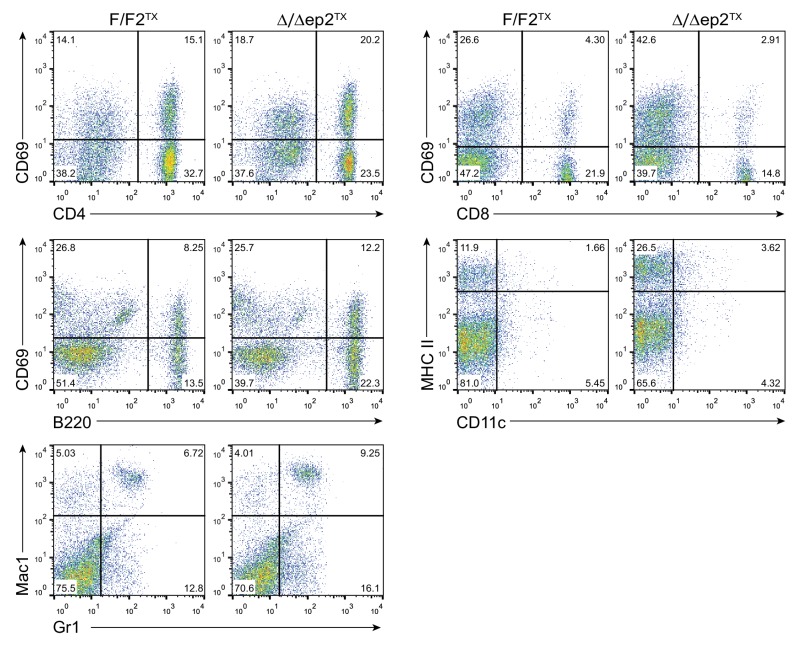
(A) PCR analysis of tail tissue (left) and immunoblot analysis of epidermal lysates obtained from Δ/Δep2TX animals. (B) Macroscopic appearance of Δ/Δep2TX mice and histological analysis of H&E sections. Scale bars, 25 µm. Infiltrating cells: mast cells (MC; TB+), activated mast cells (β1 Tryptase+; modest), granulocytes (GR; esterase+). The plot shows a quantification of the histological analysis. (C) Mild splenomegaly with increased numbers of Mac1+Gr1+ cells in Δ/Δep2TX animals. (D) Activated T cells, B cells and dendritic cells in the lymph nodes of Δ/Δep2TX animals. (E) Mild lymphocytosis and significantly elevated granulocyte numbers in Δ/Δep2TX mice. The right panel shows comparable IgE plasma levels in control and Δ/Δep2TX animals. Data are plotted as mean ± SEM (n = 5; p1 = 0.034, p2 = 0.014, p3 = 0.005, p4 = 2.63E-4, p5 = 0.001, p6 = 0.001, p7 = 0.019 and p8 = 0.042).


