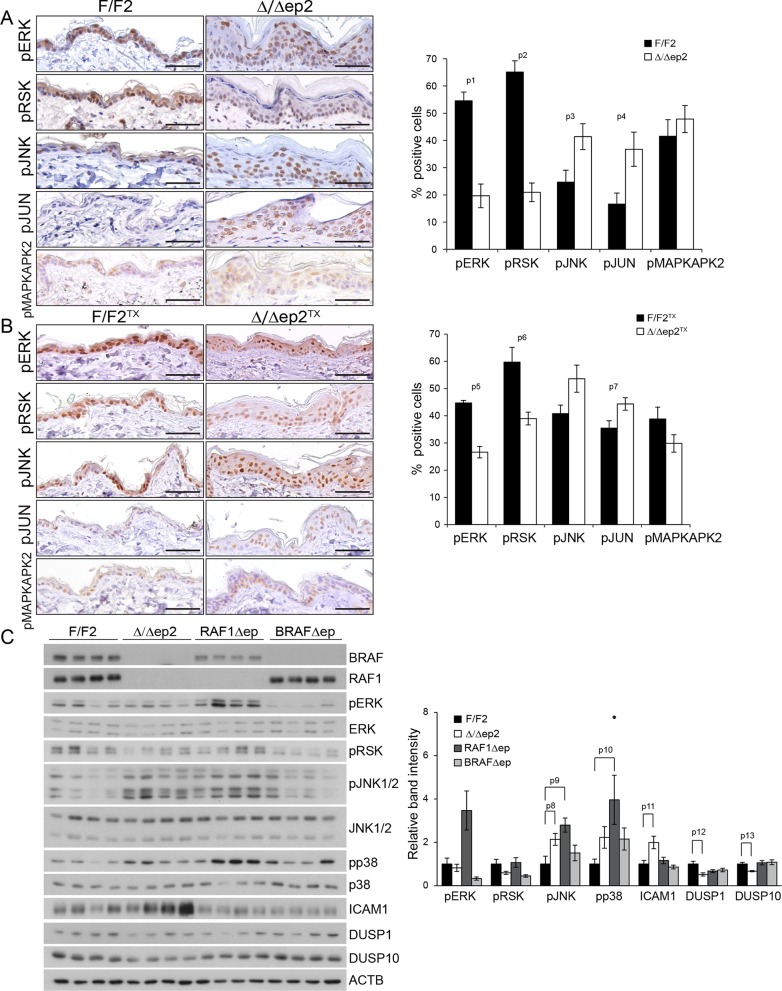
Figure 6. Molecular consequences of BRAF/RAF1 deletion in primary keratinocytes and epidermis.
(A, B) Immunohistochemical analysis of pERK and pJNK, their downstream targets pRSK and pJUN, and the p38 downstream target pMAPKAPK2 in adult F/F2 and Δ/Δep2 (A), and F/F2TX Δ/Δep2TX epidermis (B). Scale bars, 50 µm. The plots on the right show the percentage of positive cells in the epidermis (n = 4–5). (C) Immunoblot analysis of MAPK signaling in 3 weeks old epidermal lysates (n = 4), quantified as in Figure 1F. ACTB is shown as a loading control. Phosphorylation is expressed as the ratio between the signals obtained obtained with the phosphospecific antibody and with the protein-specific antibody. In both cases, the data are normalized to one of the F/F2 samples, which was arbitrarily set as 1. Data are plotted as mean ± SEM. p1 = 2.73E-4, p2 = 4.15E-5, p3 = 0.042, p4 = 0.031, p5 = 0.001, p6 = 0.023, p7 = 0.038, p8 = 0.049, p9 = 0.010, p10 = 0.030, p11 = 0.033, p12 = 0.023 and p13 = 0.018.

