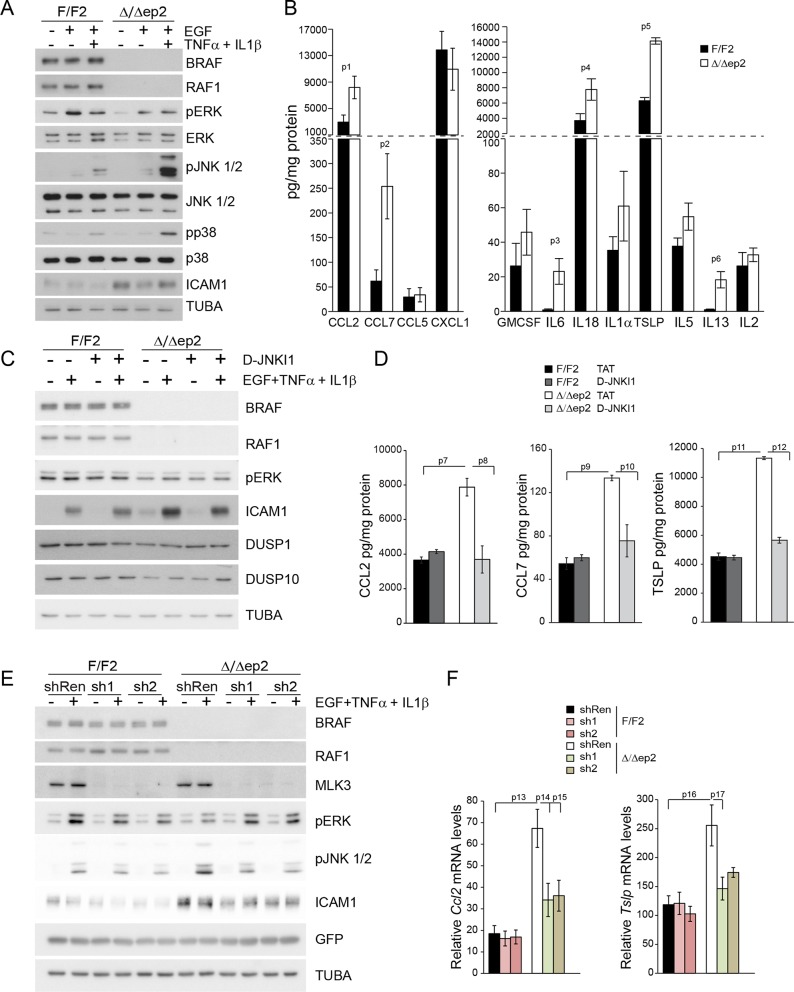
Figure 9. Increased stress kinase signaling and JNK pathway-dependent cytokine and chemokine production by primary keratinocytes lacking BRAF and RAF1.
(A) Reduced ERK phosphorylation and increased JNK/p38 activation in primary Δ/Δep2 keratinocytes stimulated with EGF and/or TNFα and IL1β for 15 min. (B) Increased cytokine and chemokine production in primary Δ/Δep2 keratinocytes treated with EGF, TNFα and IL1β for 24 hr. Cytokine and chemokine production was determined by multiplex analysis, except for TSLP which was quantified by ELISA. Data represent mean ± SEM of 3–5 biological replicates. (C–D) Cells were pretreated with D-JNKI1 inhibitors prior to stimulation with EGF, TNFα and IL1β for 15 min (C) or 24 hr (D). Data represent the mean ± SEM of technical replicates (n = 3). (E–F) Effect of shRNA-mediated Mlk3 silencing on ERK and JNK phosphorylation and ICAM1 expression (E; stimulation with EGF, TNFα and IL1β for 15 min) and on the expression of Ccl2 and Tslp mRNA (F; stimulation with EGF, TNFα and IL1β for 24 hr) by F/F2 and Δ/Δep2 keratinocytes. shRen, shRNA targeting Renilla, used as a control; sh1 and sh2, targeting Mlk3, binding sites nucleotide 2266–2285 and 2383–2402, respectively. The shRNAs were encoded by lentiviral vectors coexpressing GFP. GFP immunoblots are shown to confirm similar levels of infection in all samples. Data represent mean ± SEM of 4 biological replicates. Each keratinocyte culture represents a pool of three mice. Immunoblots are representative of three independent experiments. p1 = 0.041, p2 = 0.040, p3 = 1.89E-4, p4 = 0.018, p5 = 0.046, p6 = 0.020, p7 = 0.008, p8 = 0.016, p9 = 0.001, p10 = 0.018, p11 = 3.23E-4, p12 = 1.47E-4, p13 = 0.007, p14 = 0.03, p15 = 0.035, p16 = 0.023 and p17 = 0.046.


