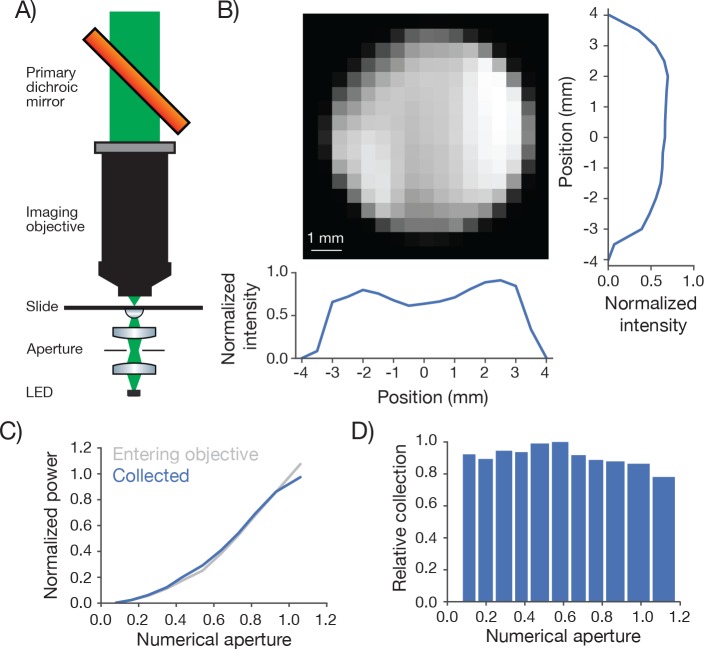
Figure 5. Measurement of collection efficiency.
(A) Apparatus for measuring signal collection across the FOV and determining the NA of the collection optics. The light source consisted of a LED (530 nm) and adjacent pinhole, with a miniature optical relay that projected the pinhole onto the top of a microscope slide. The projected spot had a 460 µm diameter. An aperture in the relay could be adjusted to change the NA of the light source from 0 to 1. (B) Normalized signal intensity measured with the PMT (not shown in A) as a function of position of the light source. The objective was moved in a 0.5 mm grid relative to the light source. Right, Y slice through the center of the image. Left, X slice through the center of the image. The peak signal was located off the main two axes. (C) Signal intensity measured by the PMT as a function of the numerical aperture of the light source (blue) overlaid on the power entering the objective (gray). As the NA of the light source increases the power entering the objective scales approximately as the square of the NA, as expected. The power entering the objective was measured with a high NA accepting power meter (Thor; S170C). Measurement was taken with the 460 µm spot in the center of the field. (D) Peak normalized ratio of the intensity measured by the PMT to the power entering the objective as a function of the NA of the light source (axis sampled non-uniformly). The signal intensity measured through the collection optics scales with the power entering the objective until it drops off around NA 1.0, significantly larger than the 0.6 excitation NA of the objective.

