. 2016 Jun 14;5:e14472. doi: 10.7554/eLife.14472

Figure 7. Imaging fluorescent proteins in anesthetized transgenic mice.

(A) Low magnification image (one section, 120 µm below the dura). The mouse expressed GCaMP6f under the thy-1 promoter (GP 5.17 line). Scanning parameters as in Figure 1Di. Field curvature correction was enabled. Average of 30 scans; power 120 mW. (B) Higher magnification image (dashed box in A). Scanning parameters as in Figure 1Dii. (C) Low magnification image (one section, 200 µm below the dura). The mouse expressed GCaMP6s under the thy-1 promoter (GP 4.3 line). Scanning parameters as in Fig. 1Di. Field curvature correction was enabled. Average of 30 scans; power 120 mW. Data corresponds to Video 1. (D) Higher magnification image (dashed box in C). Single neurons with nuclear excluded GCaMP are clearly visible. (E) Low magnification image at a deeper focal plane (one section, 450 µm below the dura). Same mouse and scanning parameters as C); power 175 mW. (F) Higher magnification image (dashed box in E) showing major somatosensory areas in layer 4. These areas appear as regions with reduced fluorescence since GCaMP6s expression is minimal in layer 4 stellate cells.

DOI: http://dx.doi.org/10.7554/eLife.14472.015

Figure 7.

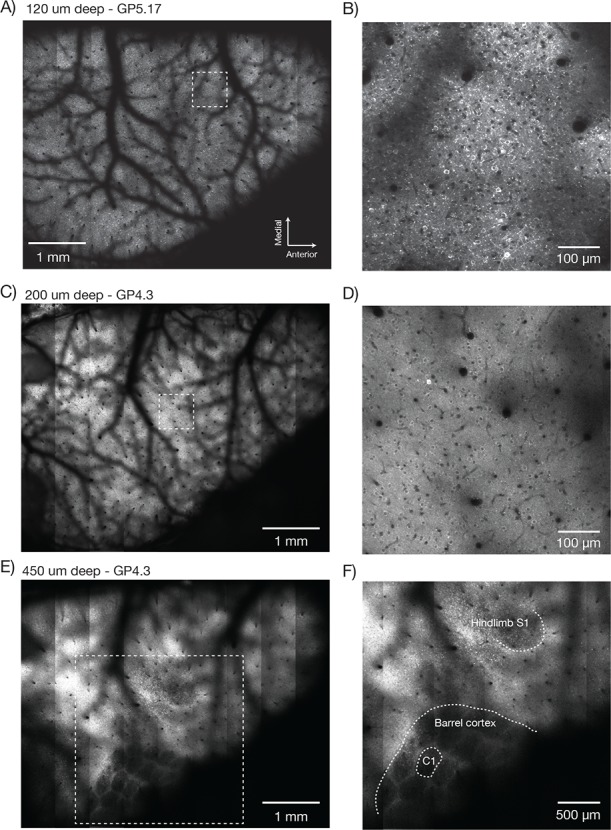
Figure 7—figure supplement 1. Overlay of a typical field of view with the reference atlas. .

Figure 7—figure supplement 1.

(A) Overlay of the image from Figure 7E with the mouse cortex (from Allen Brain Atlas, Brain Explorer 2). MOp: primary somatomotor, MOs: secondary somatomotor, SSp-ul: primary somatosensory upper limb, SSp-ll: primary somatosensory lower limb, SSp-un: primary somatosensory unassigned, SSp-tr: primary somatosensory trunk, SSp-bfd: primary somatosensory barrel field, PTLp: posterior parietal association, RSP: retrosplenial, VISam: anteromedial visual, VISpm: posteromedial visual, VISp: primary visual.
Figure 7—figure supplement 2. Counting nuclei.

Figure 7—figure supplement 2.

(A) Max projection, 100 µm to 200 µm deep, imaged in a mouse expressing GFP in the nuclei of excitatory neurons (emx1-cre x lsl-h2b-GFP). The image was locally contrast enhanced with a contrast-limited adaptive histogram equalization (CLAHE, scikit-image). (B) Blow-up of a single section showing automatically detected nuclei in red. Nuclei were detected in 3D using a local peak finding algorithm (peak_local_max, scikit-image) after median filtering. (C) Number of detected nuclei per 2 µm thick slice, smoothed with a length 3 median filter.
Figure 7—figure supplement 3. Dendritic images.

Figure 7—figure supplement 3.

(A) One slice through a mouse expressing YFP in a subset of neurons. (B) Zoom in over a dendrite with clearly visible spines.