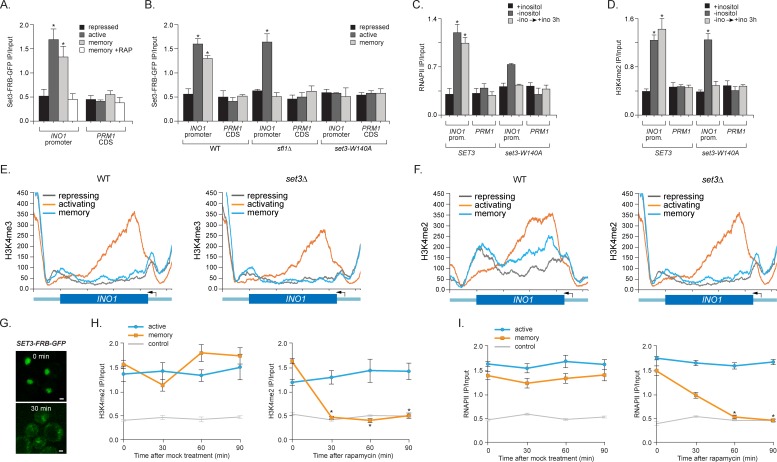
Pairwise comparisons in separate sheets including: Set3-dependent H3K4me2 loci, Loci showing high H3K4me3 under activating vs repressing conditions, Loci showing Set3-dependent H3K4me3 under activating conditions vs repressing conditions, Loci showing higher H3K4me3 in the WT vs
set3∆ strains under activating conditions and Loci that show higher H3K4me2 in the WT vs
set3∆ under all conditions. Pairwise comparisons were conducted by the following procedure: For each condition, we pooled the ChIP-seq reads from the two replicates into one sample since the ChIP-seq signal from the two replicates were exceedingly similar. Then we calculated the reads coverage score for each pooled sample. The reads coverage score at a given genomic location is defined as the number reads that cover this location after extending each single-end read from start position downstream 150 bp. This score was further normalized by the total number of aligned reads of each sample for comparisons between samples. Second, we divided the genome into overlapping bins using a sliding window of width = 500 bp and a step size of 250 bp. Under this strategy, two consecutive windows will have 250 bp overlap, such that any ChIP signal, as long as shorter than 250 bp, will be completely covered in one window. This could help better detect the differential ChIP signal (compared to using non-overlap 500 bp windows where signal may split at the window boundary). Third, for each window, we define the total coverage score
y as the summation of reads coverage score from all base pairs within the window. To illustrate our method for differential ChIP-seq analysis, we consider comparing the H3K4 tri-methylation between Repressed (REP) vs Memory (STR) conditions. We define a relative
distance measure (
D) between these two conditions as
where
and
are the total coverage score in the
window for REP and STR conditions respectively. Likewise, we define the average coverage score in the log scale as
As smaller
values tend to be unstable, the same
value at different average magnitude of ChIP signal may have different significance (
Figure 4—source data 1). We propose an adaptive criterion to select windows with significant difference. 1. For biological significance, we only considered the windows whose average signal exceeds the 10% quantile genome-wide. 2. The remaining range of
from 0.10 quantile to its maximum is divided into consecutive bins with bin width of 0.1 (in the log scale). 3. For windows within each bin, we selected windows that corresponded to the lower or upper
quantile or more extreme as putative significantly differentially methylated region. For example, in the REP vs. STR WT tri-methylation comparison, we are interested in regions that have lower tri-methylation in the REP condition. Thus we only select windows within each bin whose
values are no greater than the lower
qunatile. In this study the top 3% was used. All adjacent or overlapping windows were selected from this pipeline and merged together. For comparisons in which we expected the two samples to have a similar ChIP signal, we chose the windows corresponding to the middle 60%
values of the distribution.


