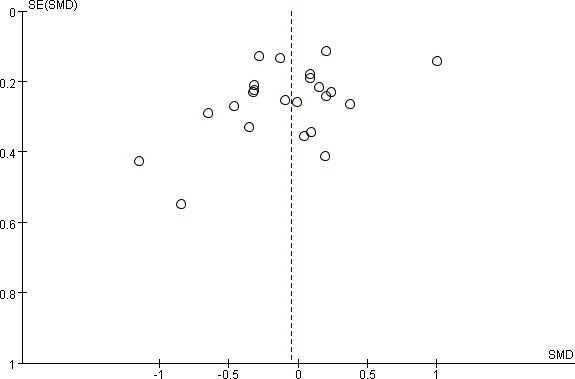
Figure 5. Funnel plot (with pseudo 95% CIs) of all individual studies in the meta-analysis.

Studies that evaluated the effect of oral isoflavone supplementation on endometrial thickness change were plotted with standard mean differences (SMDs) on the vertical axis and the SEs of the SMDs along the horizontal axis. Graph symbols were sized by weights
