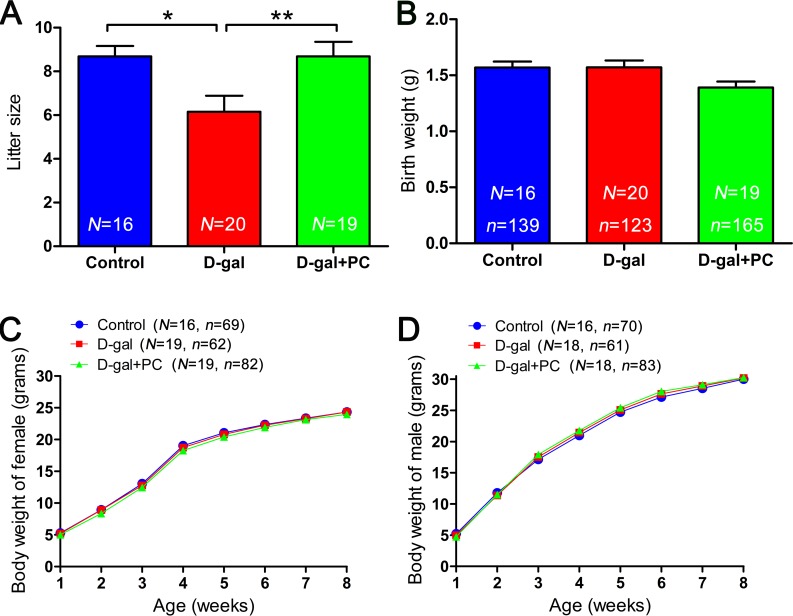
Figure 9. PC treatment led to increase in the litter size of D-gal-induced aging mice but did not influence offspring birth weight or growth rate.
A. Litter sizes in the control, D-gal, and D-gal+PC groups. B. Birth weights in the control, D-gal and D-gal+PC groups. C. Postnatal growth of female from weeks 1 to 8 in the control, D-gal, and D-gal+PC groups. D. Postnatal growth of male from weeks 1 to 8 in the control, D-gal, and D-gal+PC groups. Data are presented as the means ± SEMs for A. and B. and means for C. and D.. Data were processed by one-way ANOVA and Newman-Keuls post hoc tests. Significant differences between groups, *P < 0.05; **P < 0.01. N indicates the number of female mice with plugs and that gave birth for each treatment; n shows the total number of offspring for each treatment.

