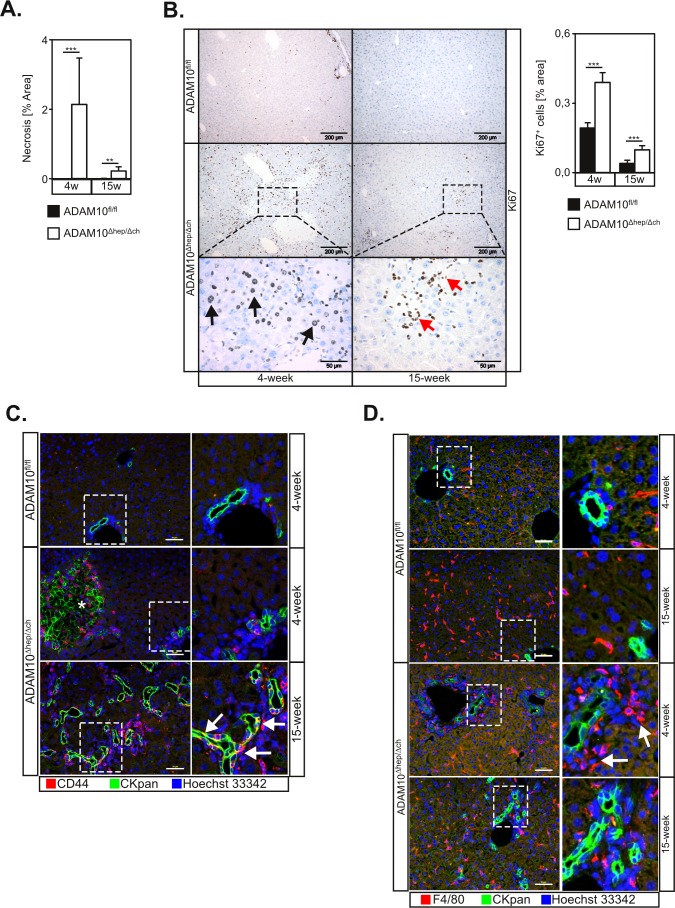
Figure 3. Loss of ADAM10 induces liver progenitor cell-mediated regeneration in ADAM10Δhep/Δch animals.
A. Quantification of necrotic areas from histological sections (n = 4-9 animals for each subgroup) of ADAM10-deficient livers of 4- and 15-week old mice suggests a decrease of tissue damage over time. B. Increased proliferation in livers of ADAM10Δhep/Δch mice as assessed by Ki67 staining. Scale bars indicate 200 μm and in the magnified area 50 μm. Black arrows designate Ki67+ hepatocytes. Red arrows indicate Ki67+ cells with a potential LPC morphology (n = 3-15 animals per subgroup). C. Ductular reaction and accumulation of LPCs in ADAM10Δhep/Δch mice as marked by CKpan and CD44 staining of liver tissue sections of ADAM10Δhep/Δch mice. Images from 4-week old wildtype animals are representative for both age groups. Asterisk mark unspecific CKpan staining of necrotic hepatocytes. Arrows indicate CKpan+ CD44+ LPCs. Scale bars indicate 50 μm. D. Clustering of macrophages around LPCs in 4-week old ADAM10Δhep/Δch mice as marked by CKpan and F4/80 macrophage staining of liver tissue sections of ADAM10Δhep/Δch mice. Arrows indicate clusters of F4/80+ macrophages. Scale bars indicate 50 μm. Data represent the mean ± standard error of the mean. (**P < 0.01; ***P < 0.001).

