
Figure 6. Heatmap of key bacterial genera responding to ECI treatments and Spearman's correlation between genera and Urea or IS.
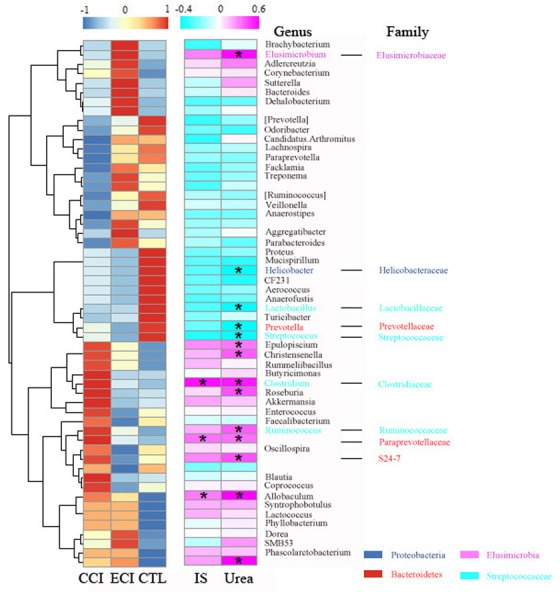
The color of spots in the left panel represents the relative abundance of the genus in each group. The color of spots in the right panel represents R-value of Spearman's correlation between genera and Urea or IS. The family and genus names are shown on the right. *p < 0.05.