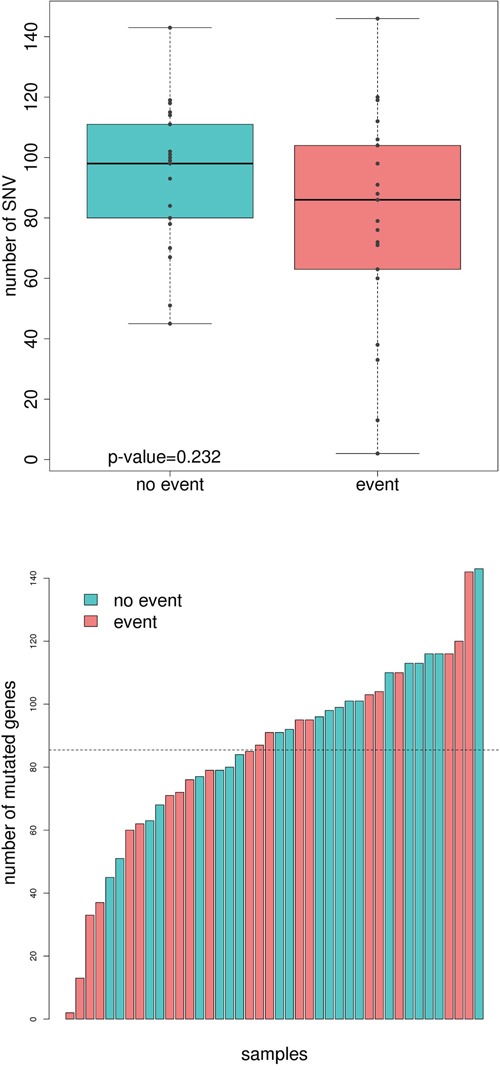
Figure 1. Comparison of total number of mutations and mutated genes between good and poor-prognosis tumors.

A. Boxplot showing the number of mutations in the group of tumors with no event (turquoise) and event (light red). B. Number of mutated genes in each sequenced sample. Those tumors from patients with no event are painted in turquoise whereas the ones who relapse are painted in light red.
