
Figure 3. Association of genes related to antigen presentation machinery with prognosis.
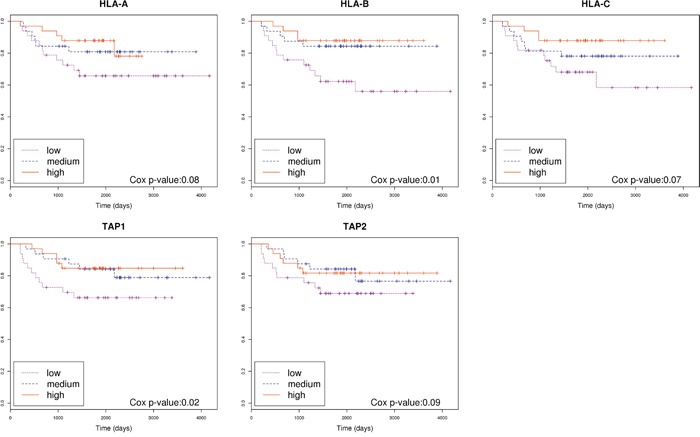
Kaplan-Meier curves separating patients based on the level of expression of genes HLA-A, HLA-B, HLA-C, TAP1 and TAP2. Cox p-value was calculated for each gene.
Official websites use .gov
A
.gov website belongs to an official
government organization in the United States.
Secure .gov websites use HTTPS
A lock (
) or https:// means you've safely
connected to the .gov website. Share sensitive
information only on official, secure websites.
Kaplan-Meier curves separating patients based on the level of expression of genes HLA-A, HLA-B, HLA-C, TAP1 and TAP2. Cox p-value was calculated for each gene.