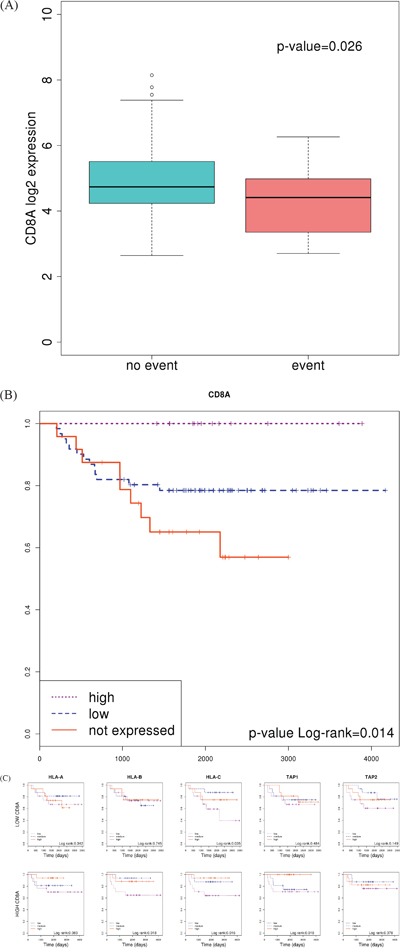
Figure 5. Association of CD8A expression with prognosis.

A. Boxplot showing differences between patients who experienced relapse or not. P value was calculated using a t-test B. Kaplan-Meier curve separating a cluster of patients of good prognosis who over-express CD8A. C. Kaplan-Meier curves separating patients based on the level of expression of genes HLA-A, HLA-B and TAP1; in tumors classified as “high CD8A” and “low CD8A”, separately.
