
Figure 1. Microarray mRNA expression profiles of CRC cell-surface markers.
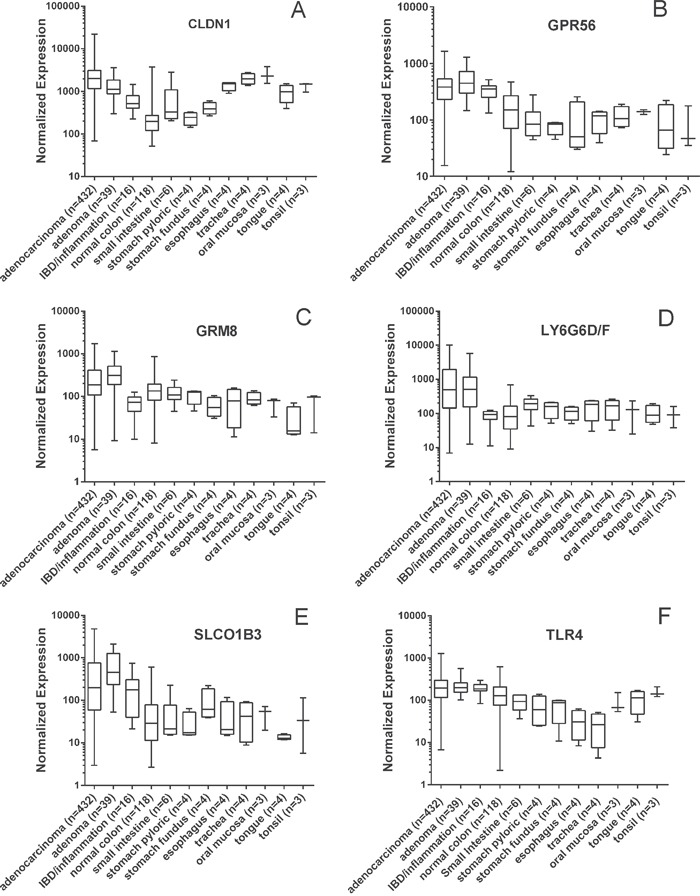
Values are presented as a whiskers/box plot with whiskers representing the full range of values, the box representing 50 percentile and middle line representing the median. Y-axis is log10 scale. For all six markers, the adenoma and adenocarcinoma values were significantly higher than the non-neoplastic normal colon values (p<0.01).