
Figure 6. Cell-surface expression of marker proteins in human CRC tumor cell lines by immunocytochemistry.
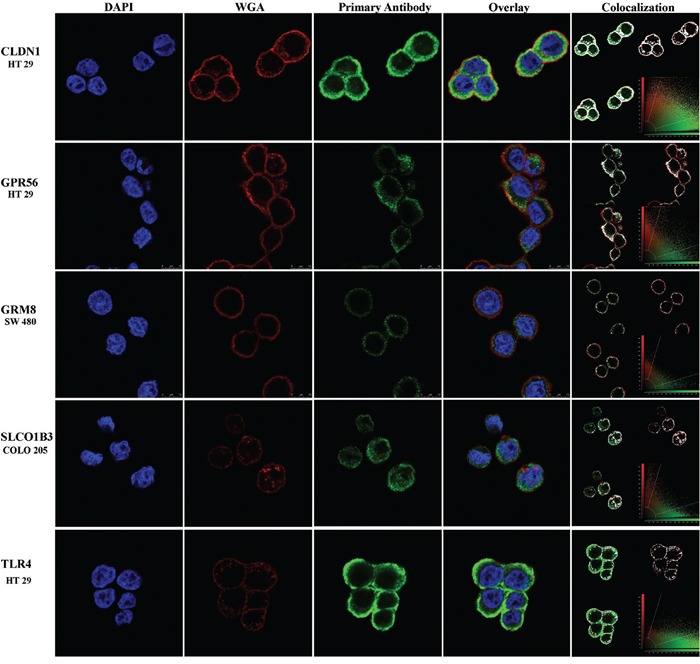
Blue, red and green colors represent the DAPI nuclear stain, WGA cell membrane stain and cell-surface marker respectively. The yellow color in the overlay panel shows co-registration of cell membrane and marker expression signals. The colocalization panel shows the range of overlap of cell membrane and marker expression in white for better visualization. Protein expression is shown but gene names are used to conserve space.