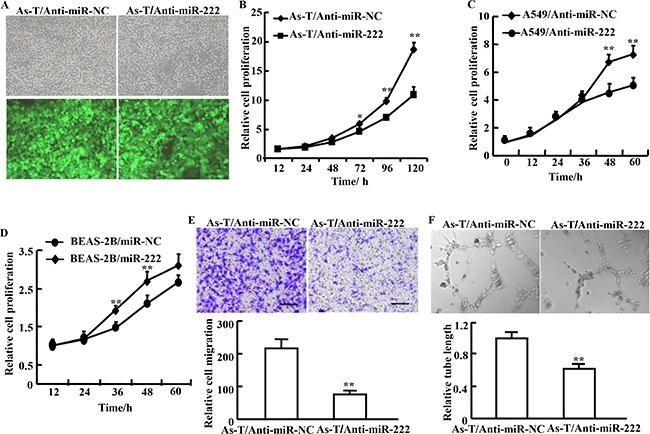
Figure 2. Treatment of cells using anti-miR-222 inhibitor decreases cell proliferation, migration, and tube formation.

(A) As-T cells were infected with lentivirus carrying anti-miR-222 inhibitor and GFP or a negative control and GFP according to the manufacturer's instruction. The cells with green fluorescence represent stably overexpressing miR-222 inhibitor (As-T/Anti-miR-222) or negative control As-T/Anti-miR-NC. (B) The CCK-8 assay was performed according to the manufacturer's instruction to analyze proliferation of As-T cells expressing anti-miR-222 inhibitor (As-T/Anti-miR-222) or negative control (As-T/Anti-miR-NC). Proliferation rates were determined at 12, 24, 48, 72, 96, and 120 h after the seeding. (C, D) Similar experiments as above were performed in A549 cells (C), and in BEAS-2B cells (D) at 12, 24, 48 and 60 h. (E) Migration of As-T cells overexpressing anti-miR-222 inhibitor (As-T/anti-miR-222) or negative control (As-T/miR-NC) using Transwell assay. (F) As-T cells at 90% confluence stably overexpressing anti-miR-NC or anti-miR-222 inhibitor were cultured in 4 mL serum–reduced medium (1% FBS) in a 10 cm dish for 24 h, then the conditioned medium was collected for tube formation assay using HUVECs as we previously described. Data are represented as mean ± SE from five replicates from each treatment. * and ** indicate significant difference compared to the control (P < 0.05 and P < 0.01, respectively). Scale bar: 500 μm. Magnification: ×400. Scale bar: 50 μm.
