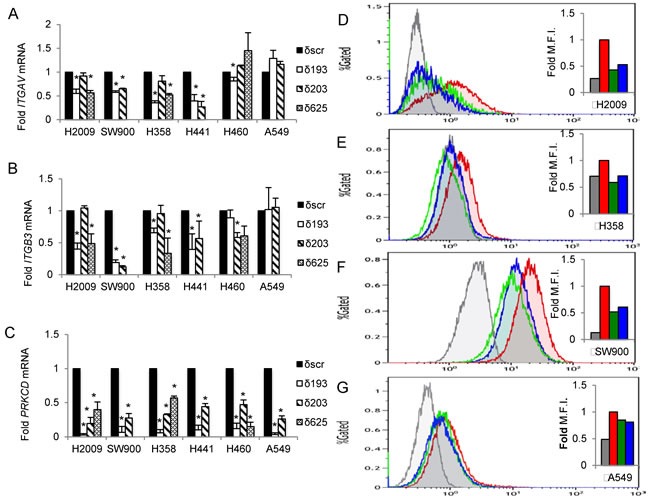
Figure 2. PKCδ regulates ITGAV and ITGB3 mRNA expression in K-ras dependent NSCLC cell lines.

PKCδ was depleted in K-ras dependent cells (H2009, SW900, H358, H441) or K-ras independent cells (H460, A549) using unique shRNAs (δ193, δ203, δ625) or a scrambled control shRNA (δscr) as described in Materials and Methods. A.-C. qRT-PCR values of ITGAV (A), ITGB3 (B) and PRKCD (C) mRNA expressed as fold of δscr control; black bars = δscr, white bars = δ193, diagonal lined bars = δ203, and hashed bars = δ625 shRNA. Error bars are standard error of the mean of three or more experiments, *p < 0.05, Student's t-test. D.-G. NSCLC cells expressing shRNA to PKCδ (δ193, δ203) or δscr were analyzed for integrin αVβ3 expression at the cell surface by flow cytometry with an antibody that recognizes the integrin αVβ3 heterodimer (LM609). K-ras dependent NSCLC cells H2009 (D), H358 (E), and SW900 (F), and K-ras independent cells A549 (G). Inset shows histogram of median fluorescent intensity, red = δscr, green = δ193, blue = δ203, grey = anti-mouse IgG. This experiment was repeated three times; a representative experiment is shown.
