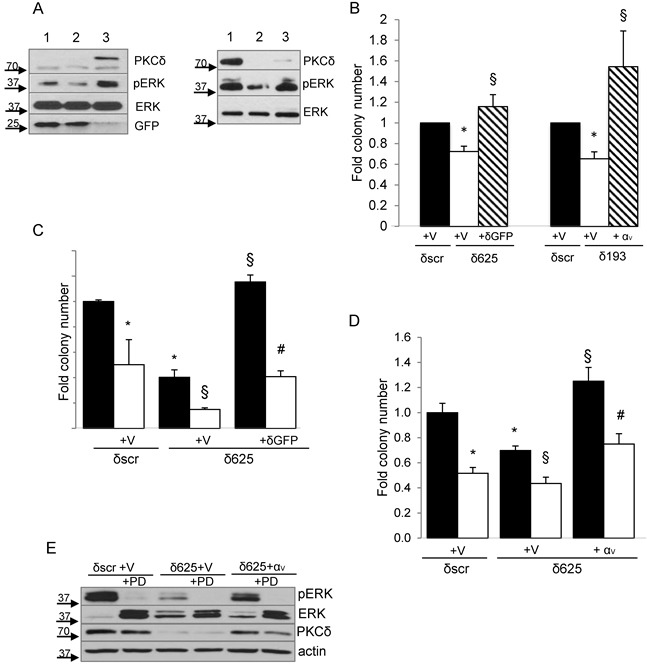
Figure 6. PKCδ regulation of transformed growth requires integrin αVβ3.

A., Left panel, H2009 δscr cells were transduced with Ad-GFP (lane 1), or H2009 δ625 cells were transduced with Ad-GFP (lane 2) or Ad-GFP-PKCδ (lane 3). Right panel, H2009-δscr cells were transiently transfected with pLenti-siLuc (lane 1) or H2009 δ193 cells were transiently transfected with pLenti-siLuc (lane 2) or pLenti-ITGAV (lane 3). Cells were harvested and probed for expression of the indicated proteins by immunoblot. Arrows indicate the position of endogenous and GFP- PKCδ. B. For PKCδ reconstitution, H2009 δscr (black bars) and δ625 cells (white bars) were transduced with Ad-GFP (V), or δ625 cells were transduced with Ad-GFP-PKCδ (δGFP) (diagonal lined bars) prior to plating in the clonogenic assay. For integrin αV rescue, H2009 δscr (black bars) and δ193 cells (white bars) were transiently transfected with pLenti-siLuc (V), or H2009 δ193 were transiently transfected pLenti-ITGAV (αv) (diagonal lined bars) prior to plating in the clonogenic assay. Values shown are an average of six experiments. Error bars represent the standard error of the mean. C. H2009 δscr or δ625 cells (black bars) were transduced with Ad-GFP (V) or Ad-GFP-PKCδ (δGFP) and put in suspension culture for 24 hours with the inclusion of 20 ug/ml of an integrin αVβ3 function blocking antibody (LM609) (white bars) or 20ug/ml anti-mouse IgG (black bars) prior to plating in a clonogenic assay. This experiment was repeated four times; a representative experiment is shown. Error bars represent the standard error of the mean. D. H2009 δscr or δ625 cells (black bars) were transfected with pLenti-siLuc (V) or pLenti-ITGAV (αv) as indicated, and then put in suspension culture for 24 hours without (black bars) or with (white bars) the inclusion of 60uM PD98059 prior to plating in a clonogenic assay. Sixty uM PD98059 was also included in the plating media. This experiment was repeated three times; a representative experiment is shown. Error bars represent the standard error of the mean. For graphs B, C, D: *p < 0.05 compared to δscr, § p < 0.05 compared to δ193 or δ625, # p < 0.05 compared to δ625-δGFP/αv. E. A representative immunoblot of cells transfected in (D) and probed for expression of the indicated proteins.
