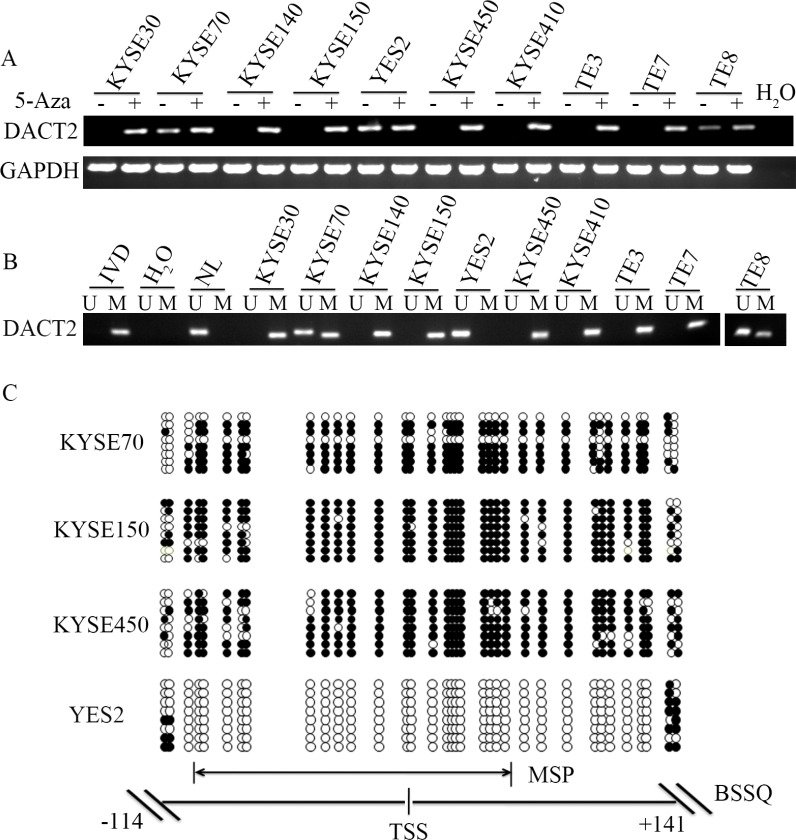
Figure 1. The expression of DACT2 is regulated by promoter region methylation in esophageal cancer cell lines.
(A) The expression of DACT2 was detected by semi-quantitative RT-PCR. H2O: negative control. GAPDH: internal control. 5-Aza: 5-aza-2′-dexycytidine; -: absence of 5-Aza; +: presence of 5-Aza. (B) MSP results in esophageal cancer cell lines. IVD: in vitro methylated DNA (methylation control); NL: lymphocyte DNA (unmethylation control); U: unmethylated alleles; M: methylated alleles. (C) Bisulfite Sequencing results: Double-headed arrow indicates the region of the MSP product. Filled circles: methylated CpG sites; open circles: unmethylated CpG sites. TSS: transcription start site.

