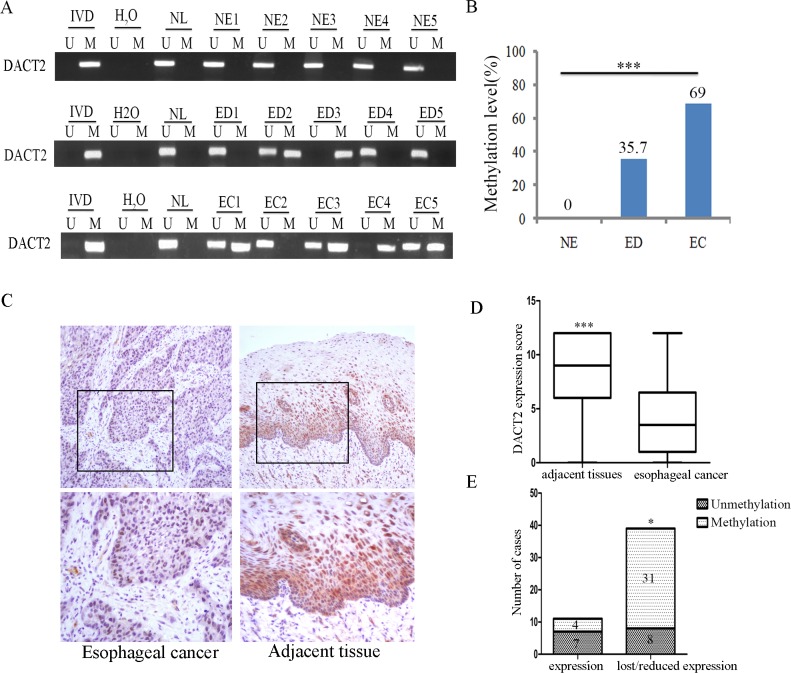
Figure 2. The methylation and expression status of DACT2 in primary esophageal cancer.
(A) Representative methylation results of DACT2 in normal esophageal mucosa (NE), esophageal dysplasia (ED) and esophageal cancer (EC). (B) DACT2 methylation frequency in NE, ED and EC. The frequency of DACT2 methylation was analyzed by chi-square test. ***P < 0.001. (C) Representative IHC staining of DACT2 in esophageal cancer (left panels) and adjacent tissue (right panels). Upper panels: ×200; lower panels: ×400. (D) DACT2 expression scores are shown as box plots, horizontal lines represent the median score; the bottom and top of the boxes represent the 25th and 75th percentiles, respectively; vertical bars represent the range of data. Expression of DACT2 was different between adjacent tissue and esophageal cancer tissue in 50-matched primary esophageal cancer samples. ***P < 0.001. (E) The expression level of DACT2 and DNA methylation status is shown as a bar diagram. Reduced expression of DACT2 was significantly associated with promoter region hypermethylation. *P < 0.05.

