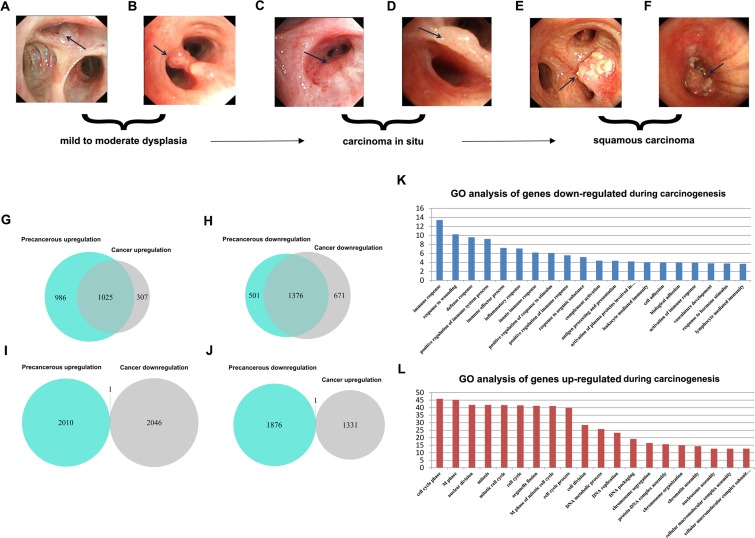
Figure 2. Identification of consistent DEGs and GO enrichment analysis.
A.-F. Bronchoscopic manifestation of multi-stage tissues during LSQC carcinogenesis. G.-J. Venn diagrams of the DEGs in precancerous and cancer stage samples. The majority of the genes differentiated in cancer were already consistently differentiated in the precancerous stage. G. Identification of 1025 consistent up-regulated DEGs. H. Identification of 1376 consistent down-regulated DEGs. I.-J. Only two DEGs were inconsistently differentiated in precancerous and cancer stages, probably as a result of noise. K. GO enrichment analysis of down-regulated consistent DEGs indicated these genes were associated with immune response. L. GO enrichment analysis of up-regulated consistent DEGs indicated that these genes were related to the cell cycle.

