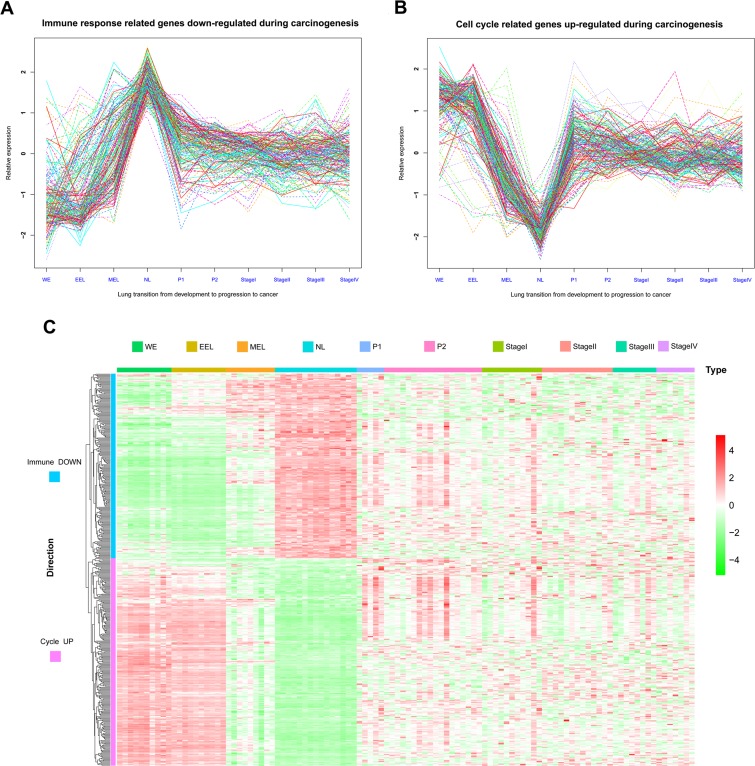
Figure 3. Matplots and heatmap of Immune DOWN and Cycle UP genes from embryonic development to cancer.
A. Matplot of Immune DOWN genes across ten time points showing that these genes were downregulated in both embryonic development and cancer. B. Matplot of Cycle UP genes, which were upregulated in both embryonic development and cancer. C. Heatmap of Immune DOWN and Cycle UP genes across ten time points. Rows represent genes, and columns represent samples from the ten time points. Genes were clustered with an unsupervised clustering algorithm (UCA). The two groups of genes were divided into two distinct clusters.

