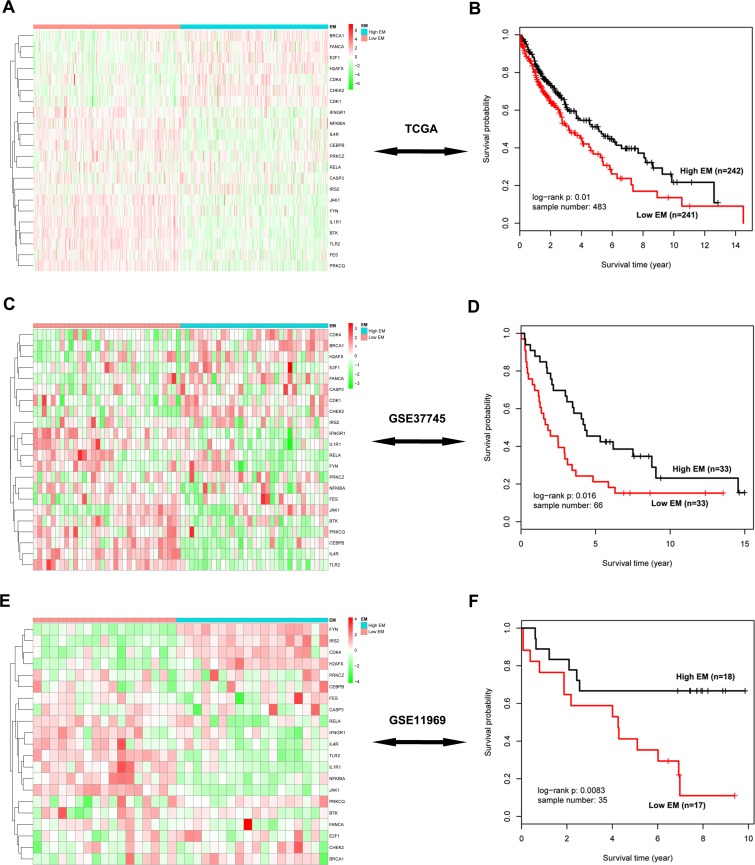
Figure 6. Survival analysis of the significant 22-gene module in three independent testing cohorts.
A. The heatmap of these 22 genes in the TCGA data. Rows represent 22 module genes, which were clustered using an unsupervised clustering algorithm, while columns represent samples, which are divided into two groups according to their corresponding EM value. B. Kaplan-Meier survival analysis of these 22 genes in the TCGA data, in which patients are divided into two EM-assigned groups. C.-D. The heatmap and survival analysis of these module genes in the GSE37745 dataset. E.-F. The heatmap and survival analysis of these module genes in the GSE11969 dataset.

