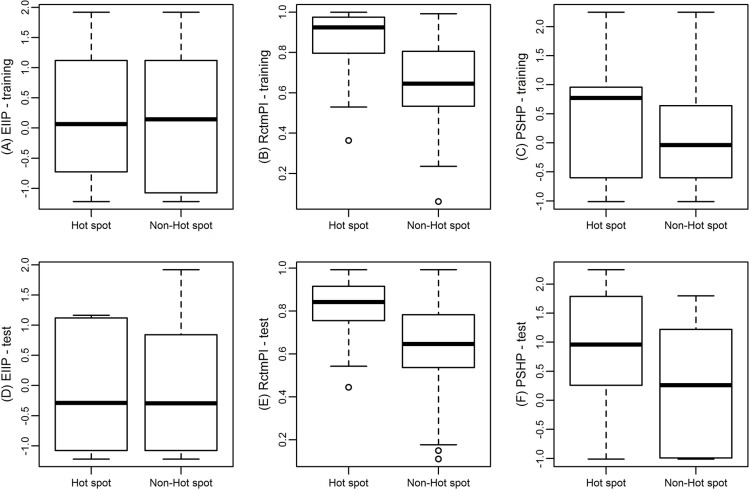
Figure 4. Box plot of hot spots and non-hot spots with respect to their EIIP (A), RctmPI (B), and PSHP (C) in training data, and EIIP (D), RctmPI (E), and PSHP (F) in test data, respectively.
In each box, the bottom and the top of the box are the lower and upper quartiles, respectively, and the middle line is the median.

