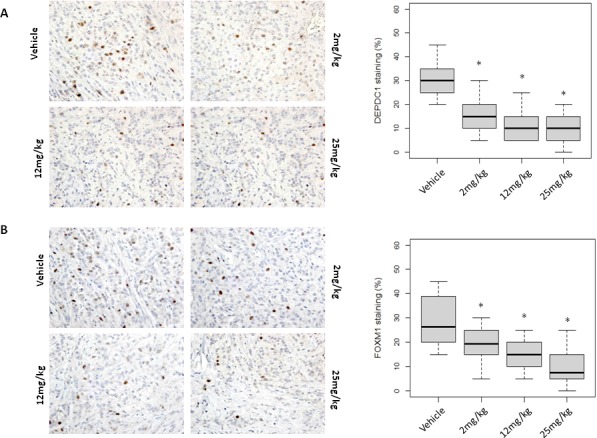
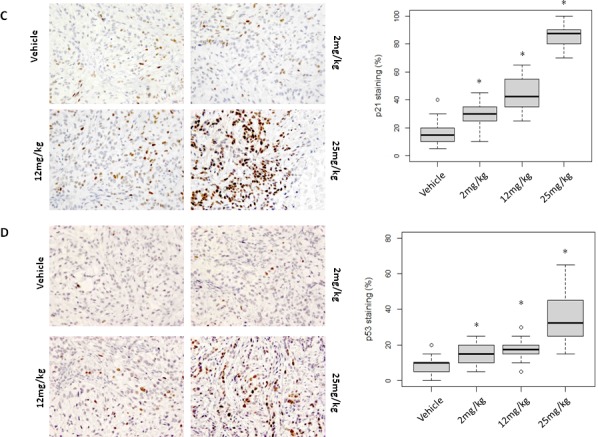
Figure 5. Molecular changes in OTS167-treated tumor tissue.


Immunohistochemical analysis using xenograft tissue collected on day 4. A. DEPDC1, B. FOXM1, C. p21, and D. p53 were examined (original magnification: x 400). Box plots represent the percentage of positive cells stained with each antibody. Horizontal lines represent mean and error bars indicating the interquartile ranges of 30 ROIs per group. *p < 0.0001 by ANOVA and t t-test.
