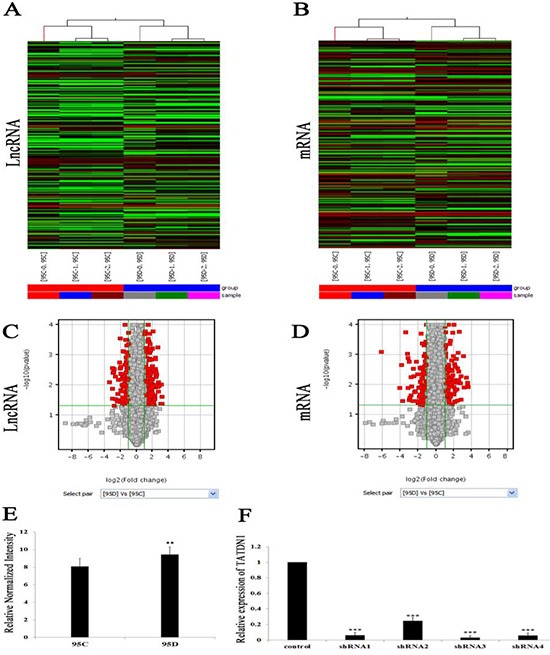
Figure 1.

(A–B) Hierarchical clustering showed the expression differences of lncRNA and mRNA between 95D and 95C cells. (C–D) Volcano plot filtering showed the differences in LncRNA expression and mRNA between 95D and 95C cells. (E) TATDN1 was highly expressed in 95D cells than 95C cells. **p < 0.01. ShRNA3 was the strongest blocker (F), ***p < 0.001.
