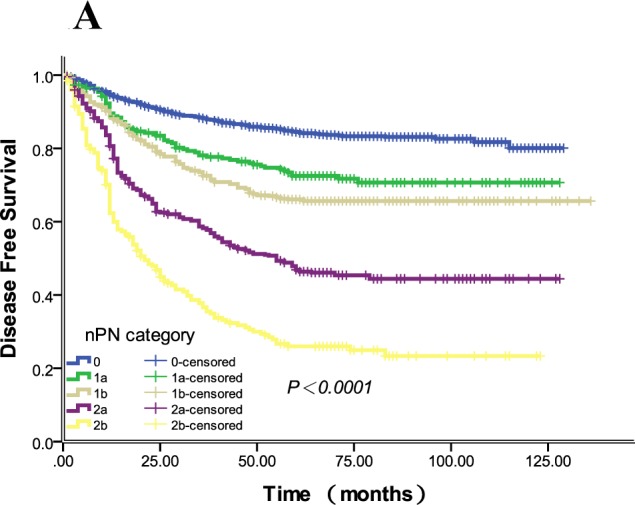
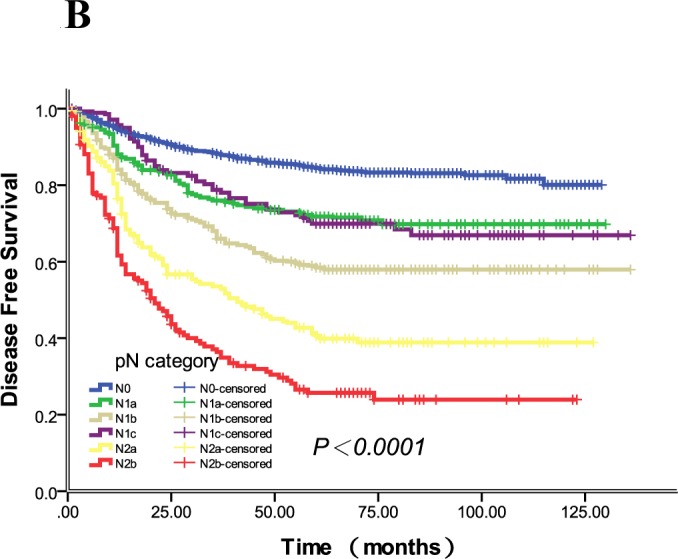
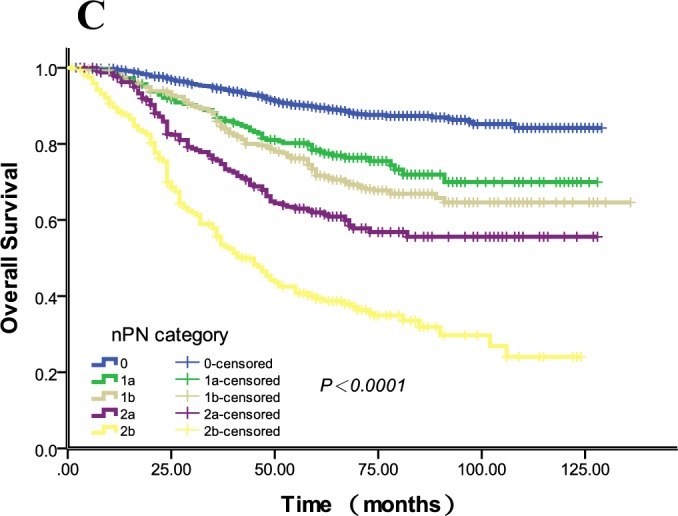
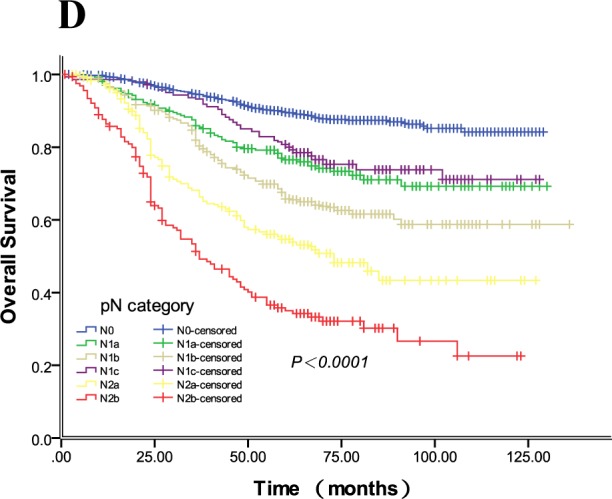
Figure 1. The DFS and OS curves for npN and pN categories.


1A. The 5-year DFS rates of npN0-2b were 83.6%, 72.4%, 65.6%, 45.7%, 26.0%,respectively (P < 0.0001), and the 5-year DFS rates of each group from npN 0 to 2b were different (all P < 0.05). 1B. The 5-year DFS rates of pN0-2b were 83.6%, 71.4%, 57.8%, 69.9%, 39.5%, and 25.8%, respectively (P < 0.0001). pN1a and 1c had similar 5-year DFS rates (P = 0.862). 1C. The 5-year OS rates of npN0-2b were 87.9%, 76.2%, 69.1%, 57.9% and 37.1%, respectively (P < 0.0001), and the 5-year DFS rates of each group from npN 0 to 2b were different (all P < 0.05). 1D. The 5-year OS rates of pN0-2b were 87.9%, 74.3%, 64.8%, 75.2%, 50.1% and 32.9%, respectively (P < 0.0001), and the 5-year DFS rates of each group from pN 0 to 2b were different (all P < 0.05). Of note, pN1c had a similar 5-year OS rate with pN1a (P = 0.303).
