
Figure 6. Expression status of miR-489 in primary breast cancer tissues.
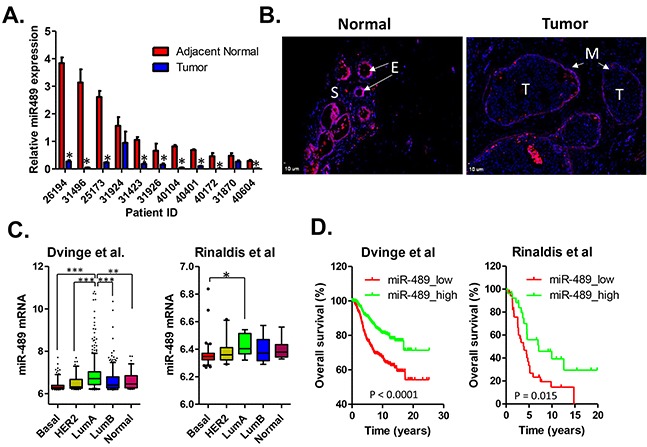
A. Real-time RT-PCR analysis of miR-489 in breast cancer tumor tissues and their adjacent normal tissues from 11 breast cancer patients. *, p value < 0.05. B. FISH analysis of miR-489 expression in normal breast tissue and adjacent tumor tissues. E, normal epithelial cells; S, stromal cells; M, myoepithelial cells; T, tumor cells. C. Relative expression levels of miR-489in breast cancer subtypes were compared using the one-way ANOVA analysis. The microarray data was extracted from previous publication [51, 52]. *, p value < 0.05; **, p value < 0.01; ***, p value < 0.001. D. Expression status of miR-489 predicts clinical outcome. Patient survival was estimated using the Kaplan-Meier method and compared with log-rank tests. The Y axis represents the probability of overall survival.